Download
1 / 36
360 likes | 525 Vues
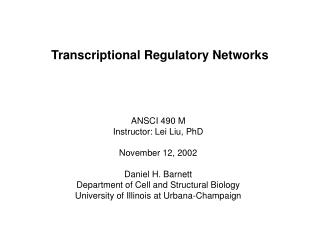
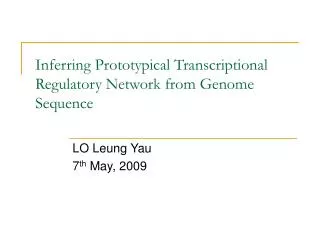
Inferring Transcriptional Regulatory Networks from Gene Expression Data II. Lectures 9 – Oct 26, 2011 CSE 527 Computational Biology, Fall 2011 Instructor: Su-In Lee TA: Christopher Miles Monday & Wednesday 12:00-1:20 Johnson Hall (JHN) 022. Review: Gene Regulation.

E N D
Inferring Transcriptional Regulatory Networks from Gene Expression Data II Lectures 9 – Oct 26, 2011 CSE 527 Computational Biology, Fall 2011 Instructor: Su-In Lee TA: Christopher Miles Monday & Wednesday 12:00-1:20 Johnson Hall (JHN) 022
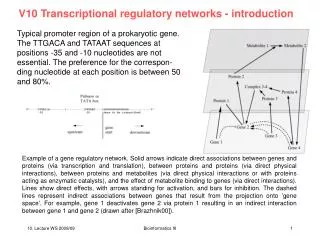
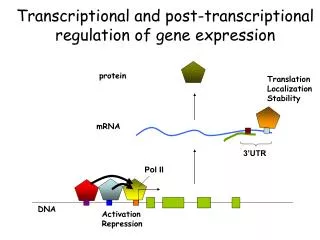
Review: Gene Regulation Expression level of Regulator controls the expression levels of Targets it binds to. ERegulator ETargets • Regulator’s expression is predictive of Targets’ expression Targets Regulator AGTCTTAACGTTTGACCGCTAATT Segal et al., Nature Genetics 2003; Lee et al., PNAS 2006
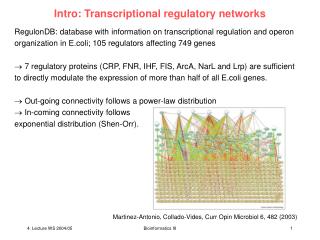
Review: Inferring the regulatory networks “Expression data” measurement of mRNA levels of all genes Arrays: conditions, individuals, etc Q≈2x10⁴ (for human) e6 … e1 eQ “Transcriptional regulatory network” • Input: • Gene expression data • Output: • Bayesian network representing how genes regulate each other at the transcriptional level, and how these interactions govern gene expression levels. • Algorithm: • Score-based structure learning of Bayesian networks • Challenge: Too many possible structures • Solutions: Control the complexity of the structure, Module networks B A C
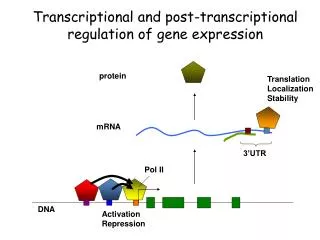
Activator X3 activator expression false true regulation program Repressor X4 repressor expression false true target gene expression Module 3 genes Repressor X4 -3 x + 0.5 x Activator X3 context A context B context C = Module3 X1 X4 X3 Review: The Module Networks Concept Tree CPDs Module 1 X1 Module 2 Module 4 X2 X4 X3 Module 3 X5 X6 induced Linear CPDs repressed
Outline • Motivation • Why are we interested in inferring the regulatory network? • Algorithms for learning regulatory networks • Tree-CPDs with Bayesian score • Linear Gaussian CPDs with regularization • Evaluation of the method • Statistical evaluation • Biological interpretation • Advanced topics • Many models can get similar scores. Which one would you choose? • A gene can be involved in multiple modules. • Possible to incorporate prior knowledge?
Motivations • “Gene A regulates gene B’s expression” • Important basic biology questions • “Gene A regulates gene B in condition C” • Condition C: disease states (cancer/normal, subtypes), phenotypes, species (evolutionary processes), developmental stages, cell types, experimental conditions • Example application (C: disease states) • Understanding histologic transformation in lymphoma • Lymphoma: the most common type of blood cancer in the US. • Transformation of Follicular Lymphoma (FL) to Diffuse Large B-Cell Lymphoma (DLBCL) • Occurs in 40-60% of patients; Dramatically worse prognosis • Goal: Infer the mechanisms that drive transformation.
Predicting Cancer Transformation Follicular Lymphoma … e1 e5 eQ N1 patients with FL Diffuse Large B-Cell Lymphoma N2 patients with DLBCL • Network-based approach • Different network features transformation mechanism? • Early diagnosis of transformation; therapeutic implications? • Share as many networks features as possible more robust than inferring two networks separately. regulatory networks gene expression data
Outline • Motivation • Algorithms for learning regulatory networks • Tree-CPDs with Bayesian score • Linear Gaussian CPDs with regularization • Evaluation of the method • Statistical evaluation • Biological interpretation • Advanced topics • Many models can get similar scores. Which one would you choose? • A gene can be involved in multiple modules. • Possible to incorporate prior knowledge?
Identify modules (member genes) Discover module regulation program false true HAP4 true false Heat Shock? CMK1 X1 X2 X3 P(Level) P(Level) X4 X3 false true (μA,σA) Level X4 Level 3 . . . -3 P(Level) false true X5 X6 Level 0 Context A Context C Context B Module 1 X1 Module 2 X4 X3 Module 3 Regulation program Goal experiments genes (X’s) Candidate regulators
Learning • Structure learning • Find the structure that maximizes Bayesian score log P(S|D) (or via regularization) • Expectation Maximization (EM) algorithm • M-step: Given a partition of the genes into modules, learn the best regulation program (tree CPD) for each module. • E-step: Given the inferred regulatory programs, we reassign genes into modules such that the associated regulation program best predicts each gene’s behavior.
Iterative procedure (EM) Cluster genes into modules (E-step) Learn a regulatory program for each module (tree model) (M-step) Learning Regulatory Network M22 M1 MSK1 KEM1 HAP4 DHH1 MFA1 MKT1 RIM15 PHO2 PHO4 SAS5 Candidate regulators Maximum increase in the structural score (Bayesian) ECM18 ASG7 MEC3 UTH1 GPA1 MFA1 TEC1 HAP1 PHO3 PHO5 PHO84 SGS1 RIM15 PHM6 PHO2 PHO4 SEC59 SAS5 SPL2 GIT1 VTC3
HAP4 Arrays sorted according to expression of HAP4 From Expression to Regulation (M-step) • Combinatorial search over the space of trees Arrays sorted in original order HAP4 PHO3 PHO5 PHO84 PHM6 PHO2 PHO4 GIT1 VTC3 12 Segal et al. Nat Genet 2003
SIP4 HAP4 From Expression to Regulation (M-step) SIP4 HAP4 PHO3 PHO5 PHO84 PHM6 PHO2 PHO4 GIT1 VTC3 Segal et al. Nat Genet 2003
Score: log P(M | D) log ∫P(D| M,,)P(,) dd 0 HAP4 • Score of HAP4 split: log P(M | D) log ∫P(DHAP4| M,, )P(,) dd + log ∫P(DHAP4| M,, )P(,) dd 0 0 Learning Control Programs Segal et al. Nat Genet 2003
HAP4 YGR043C 0 0 0 Learning Control Programs HAP4 • Split as long as the score improves 0 0 • Score of HAP4 split: log P(M | D) ∝ log ∫P(DHAP4| M,, )P(,) dd + log ∫P(DHAP4| M,, )P(,) dd • Score of HAP4/YGR043C split: log P(M | D) ∝ log ∫P(DHAP4|M,,)P(,) dd + log ∫P(DHAP4 DYGR043C|M,,)P(,) dd + log ∫P(DHAP4DYGR043C|M,,)P(,) dd
Iterative procedure Cluster genes into modules (E-step) Learn a regulatory program for each module (M-step) Review – Learning Regulatory Network M22 M1 MSK1 KEM1 HAP4 DHH1 MFA1 MKT1 RIM15 PHO2 PHO4 SAS5 HAP4 false true MSK1 false true Candidate regulators Maximum increase in Bayesian score ECM18 ASG7 MEC3 UTH1 GPA1 MFA1 TEC1 HAP1 PHO3 PHO5 PHO84 SGS1 RIM15 PHM6 PHO2 PHO4 SEC59 SAS5 SPL2 GIT1 VTC3
Module Networks* true false regulation program repressor repressor expression false true target gene expression module genes induced repressed context C context B context A activator activator expression Activator Repressor Tree regression Gene1 Gene2 Gene3 Genes in module • Learning quickly runs out of statistical power • Poor regulator selection lower in the tree • Many correct regulators not selected • Arbitrary choice among correlated regulators • Combinatorial search • Multiple local optima * Segal et al., Nature Genetics 2003
Regulation as Linear Regression S22 S1 S120 ECM18 ASG7 S1011 MEC3 UTH1 GPA1 S321 MFA1 S321 TEC1 HAP1 PHO3 PHO5 PHO84 SGS1 RIM15 PHM6 PHO2 PHO4 SEC59 SAS5 SPL2 GIT1 VTC3 GPA1 MFA1 x1 x2 RIM15 w2 w1 wN PHO2 PHO4 SAS5 … xN w2 w1 wN parameters EModule ETargets= w1 x1+…+wN xN+ε Problem: This objective learns too many regulators minimizew (w1x1 + … wNxN - EModule)2 But we often have very large N … and linear regression gives them all nonzero weight!
Lasso* (L1) Regression x1 x2 x1 x2 w2 w1 L1 term … xN L2 L1 w2 w1 wN parameters EModule minimizew (w1x1 + … wNxN - EModule)2+ C |wi| • Induces sparsity in the solution w (many wi‘s set to zero) • Provably selects “right” features when many features are irrelevant • Convex optimization problem • No combinatorial search • Unique global optimum • Efficient optimization * Tibshirani, 1996
Cluster genes into modules Learn a regulatory program for each module Learning Regulatory Network GPA1 MFA1 RIM15 PHO2 PHO4 SAS5 S22 S1 S120 ECM18 S1011 ASG7 MEC3 UTH1 GPA1 S321 S321 MFA1 TEC1 HAP1 PHO3 PHO5 PHO84 SGS1 RIM15 PHM6 L1 regression minimizew (Σwixi - ETargets)2+ C |wi| PHO2 PHO4 SEC59 SAS5 SPL2 GIT1 VTC3 Lee et al., PLoS Genet 2009
S22 S1 S120 ECM18 ASG7 S1011 MEC3 UTH1 GPA1 S321 MFA1 S321 TEC1 HAP1 PHO3 PHO5 PHO84 SGS1 RIM15 PHM6 PHO2 PHO4 SEC59 SAS5 SPL2 GIT1 VTC3 GPA1 MFA1 x1 x1 x2 x2 RIM15 PHO2 PHO4 SAS5 Learning the regulatory network Module 1 … xN w12 =0 w11 w1N Module 1 Emodule 1 Module M : Module M … xN minimizew1 (Σ w1nxn–Emodule1)2+ C|w1n| : wM2 wM1 wMN =0 =0 minimizewn (Σ wMnxn–EmoduleM)2+ C|wMn| Emodule M Multiple regression tasks
Outline • Motivation • Algorithms for learning regulatory networks • Evaluation of the method • Statistical evaluation • Biological interpretation • Advanced topics • Many models can get similar scores. Which one would you choose? • A gene can be involved in multiple modules. • Possible to incorporate prior knowledge?
Regulatory network Statistical Evaluation • Cross-validation test • Divide the data (experiments) into training and test data • Compute the likelihood function for the Test data “Test data” experiments “Test likelihood” How well the network fits to the test data? ? genes
Module Evaluation Criteria • Are the module genes functionally coherent? • Do the regulators have regulatory roles in the predicted conditions C (see slide 6) ? • Are the genes in the module known targets of the predicted regulators? • Are the regulators consistent with the cis-regulatory motifs (TF binding sites) found in promoters of the module genes?
Functional Coherence • How significant is the overlap? • Calculate P(# overlap ≥ k | K, n, N; two groups are independent) based on the hypergeometric distribution genes Modules Known functional categories N Gene ontology (GO) http://www.geneontology.org/ Predicted targets of regulators Sharing TF binding sites : n m k Module 1 Cholesterol synthesis
26 Modules>60% Coherent 41 Modules>40% Coherent Module Functional Coherence • Metabolic:AA, respiration, glycolysis, galactose • Stress:Oxidative stress, osmotic stress • Cellular localization: Nucleas, ER • Cellular processes: Cell cycle, sporulation, mating • Molecular functions:Protein folding, RNA & DNA processing, trafficking
HAP4 known to up regulate Oxid. Phos. Respiration Module
HAP4, MSN4, XBP1 known to be regulators under predicted conditions Respiration Module • HAP4 known to up regulate Oxid. Phos.
HAP4 Binding sitefound in 39/55 genes Respiration Module • HAP4 known to up regulate Oxid. Phos. • HAP4, MSN4, XBP1 known to be regulators under predicted conditions
Respiration Module • HAP4 known to up regulate Oxid. Phos. • HAP4, MSN4, XBP1 known to be regulators under predicted conditions • HAP4 Binding sitefound in 39/55 genes • MSN4 Binding sitefound in 28/55 genes
Outline • Motivation • Algorithms for learning regulatory networks • Evaluation of the method • Advanced topics • Many models can get similar scores. Which one would you choose? • A gene can be involved in multiple modules. • Possible to incorporate prior knowledge?
… Structural learning via boostrapping • Many networks that achieve similar scores • Which one would you choose? • Estimate the robustness of each network or each edge. • How?? Learn the networks from multiple datasets. 33.15 33.10 32.99 Inferring sub-networks from perturbed expression profiles, Pe’er et al. Bioinformatics 2001
… Bootstrapping • Sampling with replacement … genes experiments … Original data Bootstrap data 1 data 2 data N Inferring sub-networks from perturbed expression profiles, Pe’er et al. Bioinformatics 2001
Estimated confidence of each edge i 0.8 0.31 0.75 0.56 0.43 0.26 0.73 … Bootstrapping • Sampling with replacement … … Bootstrap data 1 data 2 data N Inferring sub-networks from perturbed expression profiles, Pe’er et al. Bioinformatics 2001
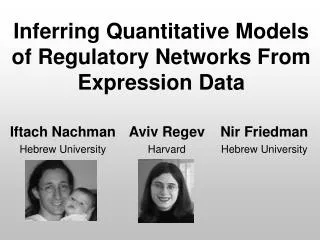
Overlapping Processes • The living cell is a complex system • Example, the cell cycle • Cell cycle: the series of events that take place in a cell leading to its division and duplication. • Genes functionally relevant to cell cycle regulation in the specific cell cycle phase Partial figure from Maaser and Borlak Oct. 2008 Genes participate in multiple processes • Mutually exclusive clustering as a common approach to analyzing gene expression • (+) genes likely to share a common function • (-) group genes into mutually exclusive clusters • (-) no info about genes relation to one another
HAP4 false true MSK1 false true DHH1 false true PUF3 false true HAP1 false true HAP5 true false Decomposition of Processes… • Model an expression level of a gene as a mixture of regulatory modules. • Hard EM vs soft EM w1 w2 X : wN Probabilistic discovery of overlapping cellular processes and their regulation Battle et al. Journal of Computational Biology 2005