Download
1 / 82
890 likes | 1.37k Vues
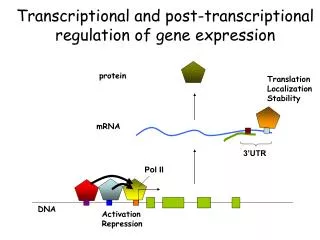
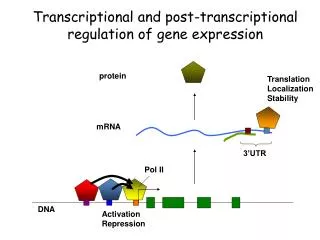
Transcriptional and post-transcriptional regulation of gene expression. protein. Translation Localization Stability. mRNA. 3’UTR. Pol II. DNA. Activation Repression. 5’ upstream. Using gene expression to identify regulatory elements. Gene expression.

E N D
Transcriptional and post-transcriptional regulation of gene expression protein Translation Localization Stability mRNA 3’UTR Pol II DNA Activation Repression
5’ upstream Using gene expression to identify regulatory elements
Gene expression Feb 2007: ~110,000 arrays in NCBI GEO Allen Institute Mouse Brain Gene expression Atlas (in situ hybridization, ~23,000 genes) Feb 2008: ~202,000 arrays
How do you identify regulatory elements from gene expression ? Roth et al., 1998, Tavazoie et al., 1999: co-expressed genes often share the same regulatory elements • Motif finding programs: • - AlignACE (Hughes et al, 2000) • MEME • REDUCE (Bussemaker et al, 2001) • and many others … 5’ upstream Expression
Problems with current motif finding approaches Different approaches for different types of expression data C0 C1 C2 C3 C4 Single microarray (e.g. log-ratios) REDUCE Co-expression clusters ALIGNACE
Problems with current motif finding approaches Many unrealistic assumptions, e.g., zeroth order background sequence model in AlignACE 1kb upstream region of Plasmodium falciparum PF11_0108 TTTAAAAAAAAAAAAAAAAAGAGAAAAACCATATTTATATGGATATAATATTTTTAAAGTATAGAAAAAATAATATATATTTATATACATTTATATTAATGAAAAAGCAAACAGCTAAATTACAAAAAAAAAAAAAAATTAGATTATCTCAATTAAAAGAACAATATATAAATAATTAATCCATGCTATTTTTTGATATATATAAGAATTTAATGCCTTATATTATAAATAGAGAAATAAATAAATAAATAAATATATAAACATATATATTATATATATATATATATATATAGTTATACATTATGATTTTGAAAAAATAGATATATACTATTAATTGTATATGTTTATACATAAAGCATATTTTTATTAATTGTAATATATAGATTTTTTATTATAATAATATTATATATATATATATATATATATATATTTTTTTTTTTTTGTTAAATAGCGAAATAAAAATACCTGACCTTTGTAATCTTTATTTGATTACTTCCTTCTTCATTCCTTCTTTGTTTGTTTGTTTGTTTCCCTTTTTTTTTTTTTTTTTTTTTTTTTTAGTTAATTCTTTTATATGTATAATAATATTATAAGACAATTGGACAATGATTACAAAAAGGTAAAAGTAATAATTTTCTAAAGTATAATATAATATTATAATAATATAATATAAATTTTTAATAAAATTTAATAAAAAAGTTTATAAATACTTATCGACCATAAGTCGTTTAAGAAAAAAAAAAAAAAGAAAAAAAAAAAAAAATATTACAAAAATATTATAGTGTATTATATTTTATCATATCATCTTTTTTTTATTTTTTTTTATATTTTTGTTACGGCACATCAAGCAACTATAAATATTTAAGATCAACCACCAAAAAAAAAAAAAAAAAAAAAAAAAAAAAACATTATTTATGGTATTTTAAA
Problems with current motif finding approaches Elevated false positive rate k-means clustered gene expression many motifs many motifs randomly clustered gene expression AlignACE
Re-thinking motif discovery from expression data • One approach for all types of expression data • Make as few a priori assumptions as possible • Very low false positive rate • Scale to complex metazoan and plant genomes Noam Slonim
Clusters of co-expressed genes Microarray Conditions Cluster Index 0 1 All Genes on array 2 3 4
These genes belong to cluster 0 These genes belong to cluster 1 These genes belong to cluster 2 Our approach: look for motifs whose profile of presence/absence is informative about the expression profile Cluster index 5’ upstream regions 0 0 0 correlation is quantified using the mutual information 0 0 Expression (Cluster Indices) 1 1 0 1 2 1 1 Absent 1 Motif Present 2 2 2 2 ... 2
Continuous expression variables (e.g. microarray log-ratios) 5’ upstream region Log-ratio 6.45 4.39 3.50 1.98 1.54 0.45 0.12 0.01 -0.08 -0.87 -1.56 -2.32 -2.89 -5.65 -8.90
Expression cluster index Expression cluster index 3’UTRs 5’ upstream regions 0 0 0 0 0 0 0 0 0 0 1 1 1 1 1 1 1 1 1 1 2 2 2 2 2 2 2 2 2 2 RNA DNA
finding all informative DNA and RNA motifs How do we do it ?
Words (k-mers) GCGATGAG Degenerate code [AC]CGATGAG[TC] Weight matrices Possible motif representations Accuracy Search space very good very large good large acceptable small
Highly informative k-mer MI CTCATCG 0.0618 TCATCGC 0.0485 AAAATTT 0.0438 GATGAGC 0.0434 AAAAATT 0.0383 ATGAGCT 0.0334 TTGCCAC 0.0322 TGCCACC 0.0298 ATCTCAT 0.0265 ... ... ACGCGCG 0.0018 CGACGCG 0.0012 TACGCTA 0.0011 ACCCCCT 0.0010 CCACGGC 0.0009 TTCAAAA 0.0005 AGACGCG 0.0004 CGAGAGC 0.0003 CTTATTA 0.0002 MI=0.081 MI=0.045 MI=0.040 ... Not informative Motif Search Algorithm
A/G C/G/T T/G A/T/G C/G A/C/G Optimizing k-mers into more informative degenerate motifs Cluster Indices 5’ upstream regions ATCCGTACA 0 0 0 0 0 1 1 1 1 ATCC[C/G]TACA 1 2 2 which character increases the mutual information by the largest amount ? 2 2 2
A/C C/G/T T/C A/T/C C/G A/C/G Optimizing k-mers into more informative degenerate motifs Cluster Indices 5’ upstream regions 0 0 0 0 0 1 1 1 1 ATCC[C/G]TACA 1 2 . . . 2 2 2 2
Mutual information change Similarity to ChIP-chip RAP1 motif RAP1 binding site (ChIP-chip) Motif Conservation with S. bayanus
Motifs optimized so far k-mer MI CTCATCG 0.0618 TCATCGC 0.0485 AAAATTT 0.0438 GCTCATC 0.0434 AAAAATT 0.0383 ATGAGCT 0.0334 TTGCCAC 0.0322 TGCCACC 0.0298 ATCTCAT 0.0265 ... MI=0.081 Highly informative k-mers MI=0.045 optimize ? Only optimize k-mer if I(k-mer;expression | motif) is large enough (for all motifs optimized so far) Conditional mutual information I(X;Y|Z)
Each motif is subjected to a stringent statistical significance test Maximum of 10,000 expression-shuffled mutual information values Real mutual information value
The regulation of gene expression is highly combinatorial Pol II Expression pattern 1 DNA Expression pattern 2 Expression pattern 3
The regulation of gene expression is highly combinatorial Can we group our predicted motifs into modules of combinatorially acting regulatory elements ?
Predicting combinatorial regulation using mutual information 5’ upstream region Is the presence of motif 1 informative about the presence of motif 2 ? Motif 2 Absent Present Absent Motif 1 Present
Discovering modules of combinatorially acting motifs modules
Results P. falciparum Yeast Human (malaria parasite)
Yeast stress gene expression program (Gasch et al, 2000) • 173 microarray conditions • ~ 5,500 genes • 80 co-expression clusters • Runtime ~ 1h (standard PC)
Expression Clusters 17 motifs in 5’ upstream regions 6 motifs in 3’UTRs 0 “motifs” when shuffling the gene labels of the clustering partition 1129 motifs when applying AlignACE (with default parameters) to each cluster independently Predicted Motifs 880 “motifs” when applying AlignACE to the same shuffled clusters as above
Expression Clusters PAC RRPE PUF4 PUF3 MSN2/4 RAP1 RPN4 REB1 MBP1 HAP4 XBP1 BAS1 CBF1 SWI4 14 previously known motifs All 23 motifs are highly conserved with S. bayanus 13 modules of co-occurring motifs Predicted Motifs
Predicted cooperation between DNA and RNA motifs over-represention PAC is under-represented in cluster 13 (p<1e-5) PAC is highly over-represented in cluster 66 (p<1e-20) Expression Clusters Motifs PAC 5’ 5’ RRPE Puf4 3’UTR under-represention
Expression Clusters PAC RRPE PUF4 PUF3 MSN2/4 RAP1 RPN4 REB1 MBP1 HAP4 XBP1 BAS1 CBF1 SWI4 Predicted Motifs
Cytosolic ribosome, p<1e-18 Mitochondrial ribosome, p<1e-33 Mitochondrial ribosome, p<1e-29 Puf3
Functional enrichments Rpn4 Proteasome complex (p<1e-44) Mbp1 DNA replication (p<1e-7) Novel motif Oxydative phosphorylation (p<1e-17)
We also use mutual information to discover … Non-random spatial distribution Orientation preferences Co-localization Beer and Tavazoie, 2004; Elemento and Tavazoie, 2005
Very far Far Close Cluster Indices Cluster Indices 5’ upstream region 0 0 0 0 0 0 0 0 0 0 1 1 1 1 1 1 1 1 2 2 2 2 2 2 2 2 Distance to TSS is informative about expression Distance between two motifs is informative about expression
Y Y Y Y Y Y Y Y Y Y Y Y Clusters > 50% of our predicted motifs have a non-random spatial distribution Predicted Motifs
-600bp ATG PAC has a non-random spatial distribution Clusters where the motif is over-represented Clusters where the motif is NOT over-represented
RAP1 motif has a different kind of non-random spatial distribution Unique cluster where the motif is over-represented Clusters where the motif is NOT over-represented RAP1 motif also has a strong orientation preference
ATG -600bp PAC and RRPE tend be co-localize on the DNA Clusters where the TWO motifs are both over-represented Clusters where the motifs are NOT over-represented
-600bp ATG PAC and the Msn2/4 binding site tend to avoid being in the same promoters
Single array analysis Down-regulated Up-regulated Cy3/Cy5 expression log-ratios PAC Rpn4 Yap1 Puf3 H2O2 treatment in ΔMsn2/ΔMsn4 background
P. falciparum intra-erythrocytic developmental cycle 0h Time 48h Associate a “phase” to each gene, which reflects the timing of maximal expression ~ 2,700 periodically expressed genes Bozdech, Llinás, et al., PLoS Biol, 2003
Discovering motifs that are informative about the expression phase 5’ upstream region Phase -3.14 -2.56 -2.34 -1.68 -0.38 -0.25 -0.12 0.01 0.08 0.34 0.67 2.32 2.89 3.01 3.14
-π Phase +π 21 motifs in 5’ upstream regions 0 motifs in 3’UTRs 0 “motifs” when shuffling the gene labels of the phase profile 71% highly conserved with P. yoelli DNA replication, p<1e-4 plastid, p<0.01 ribosome, p<0.001
Independent biochemical validation - Purified 3/26 predicted TF in P. falciparum • Identified DNA-binding specificities using protein binding microarrays Bulyk lab, Harvard Llinás lab, Princeton University, submitted
Motifs Match Predictions GST AP2 GST AP2 AP2 Protein Binding Microarray GST AP2 FIRE Prediction
-π Phase +π bound by MAL6P1.44 bound by PF11_0404 bound by PF14_0633 Independent biochemical validation for 3/21 motifs More TFs being purified ...
Human gene expression atlas(Su et al, 2004, PNAS) • 79 human tissues • >17,000 genes • 120 co-expression clusters • Runtime ~ 24h (standard PC)
73 DNA motifs 42 RNA motifs 71 modules ELK4 Sp1 AhR bZIP911 NF-Y E2F1 TCF11-MafG Pax2 E2F v-Myb TEAD Dof2 CHOP-C/EBPalpha HAND1-TCF3 GBP Skn-1 HFH-3 Sox17 miR-499/miR-505/miR-200a/miR-141 miR-525/miR-518f*/miR-526c/miR-526a/miR-520a* miR-380-3p/miR-215/miR-485-3p/hsa-let-7g/miR-610/hsa-let-7i/hsa-let-7b/hsa-let-7a miR-30d/miR-30c/miR-30a-5p/miR-30e-5p/miR-30B miR-200b/miR-429/miR-200c miR-663
M phase (p<1e-43) novel NF-Y
Olfactory receptor activity (p<1e-43) novel TCF11-MafG
![[VI]. Post-Transcriptional Processing and Post-Transcriptional Control of Gene Expression](https://cdn1.slideserve.com/3214110/vi-post-transcriptional-processing-and-post-transcriptional-control-of-gene-expression-dt.jpg)
![[V]. Process of Transcription and Transcriptional Control of Gene Expression](https://cdn2.slideserve.com/5058527/v-process-of-transcription-and-transcriptional-control-of-gene-expression-dt.jpg)