Download
1 / 15
160 likes | 307 Vues
Satellite data products to support climate modelling: Phenology & Snow Cover Kristin Böttcher, Sari Metsämäki, Olli-Pekka Mattila, Mikko Kervinen, Mika Aurela, Saku Anttila. Content. Introduction & objectives Satellite time-series Vegetation indices Snow cover

E N D
Satellite data products to support climate modelling: Phenology & Snow Cover Kristin Böttcher, Sari Metsämäki, Olli-Pekka Mattila, Mikko Kervinen, Mika Aurela, Saku Anttila
Content • Introduction & objectives • Satellite time-series • Vegetation indices • Snow cover • Extraction of start of season from satellite time-series • In situ data • Comparison of satellite-derived indicators with in situ dates • Maps for the start of season in Finland • Summary & Outlook
Introduction & objectives • Sparse observation network for validation of model results • Need to generalize information provided by in situ sites • Provide time-series of vegetation indices and snow cover for the evaluation of the performance of JSBACH model in the spatial domain • Assessment of snow-related variables of JSBACH: comparison of model output and remote sensing data • Definition of proxy indicators for ecosystem functioning (e.g. start of growing season) from remote sensing data
Satellite time-series • Daily time-series of satellite-indices derived from Terra/ Moderate Resolution Imaging Spectrometer (MODIS) 2001-2010 • Normalized Difference Vegetation Index (NDVI), 250 m • Normalized Difference Water Index (NDWI), 500 m • Snow Covered Area (SCA), 500 m Sat. Data Snow cover and vegetation estimates Pixel-based land use information Pre-processing, Cloud masking Time-series for different years Extraction of time-series Fraction of coniferous forest (green), broadleaf deciduous forest (red), open bogs (blue)
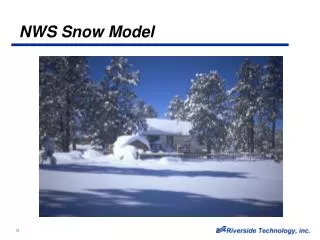
NDVI-Product (left) and NDWI-Product (right) 2007-06-08
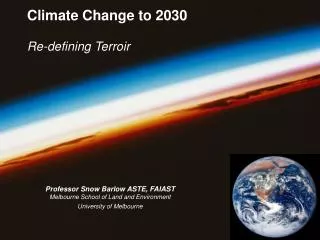
16.4.2011 17.4.2011 10.4.2011 30.3.2011 Snow Covered Area product for spring 2011 8.5.2011 13.5.2011 23.4.2011 24.4.2011 25.4.2011 19.4.2011
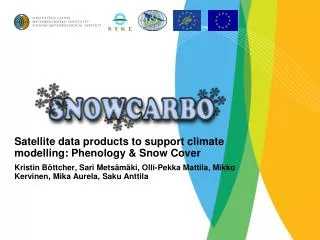
Comparison of model output and RS data MODIS snowfraction JSBACH snowfraction April 21, 2003 May 04, 2003
Extraction of start of season • Spring phenology influences terrestrial carbon balance (Richardson et al. 2010) • In broadleaf forest the start of growing season is linked to development of leafs • Photosynthetic recovery in evergreen coniferous forest occurs before canopy changes • Aim to develop satellite-derived start of season indicator calibrated to in situ observations at CO2 flux measurement sites budburst Richardson et al.(2010). Influence of spring and autumnphenologicaltransitions on forestecosystemproductivity. PhilosophicalTransactions of the Royal Society B: Biological Sciences, 365, 3227-3246 Phenologicalstages of birchtrees
In situ observations • Reference dates for onset of growing season for coniferous forest and wetland sites determined from CO2 flux measurements • A fixed fraction of peak growing season gross primary production (GPP) was used as a threshold value for the growing season onset
Sodankylä: Coniferous forest • Onset of growing season in coniferous forest coincides with decrease of fractional snow cover and beginning of spring-rise of NDVI (a) Mean Snow Covered Area and interpolated profile; (b) Snow depth measurement station Sodankylä; (c) Mean NDVI and smoothed profile; (d) Mean NDWI and linear interpolated profile. Start of season 07.05.2010
Kaamanen: Fen • NDWI minimum in spring corresponds to the vegetation state before greening-up • actual greening-up may lag end of snow melt for a certain period (Delbart et al. 2005) http://www.fluxdata.org:8080/ SitePages/siteInfo.aspx?FI-Kaa (a) Mean value Snow Covered Area and interpolated profile; (b) Mean NDVI and interpolated profile; (c) Mean NDWI and linear interpolated profile. Delbart, N. et al., 2005. Determination of phenological dates in boreal regions using normalized difference water index. Remote Sensing of Environment 97, 26-38.
Satellite-derived start of season • Comparison of satellite-derived start of growing season for evergreen coniferous sites with in situ dates FGS: FluxGrowingSeason. Doy: day of year.
Maps of the start of growing season • Extraction of start of season based on NDVI and NDWI time-series (Delbart et al. 2005) for pixels with dominance of coniferous forest and wetlands • Aggregation of results for comparison with JSBACH land surface model-derived start of season Delbart, N. et al., 2005. Determination of phenological dates in boreal regions using normalized difference water index. Remote Sensing of Environment 97, 26-38.
Summary • Harmonized MODIS time-series for describing the annual cycle of vegetation and the evolution of snow cover during the melting period for comparison with model output • Comparison of observed and modelled snow cover indicate delayed melting in the model • Proxy indicator for the start of season of evergreen coniferous trees from MODIS time-series • Different method needs to be applied for deciduous species
Outlook • Comparison of satellite-derived and modelled start of season • Length of season estimate from satellite time-series