Download
1 / 55
560 likes | 737 Vues
Climate change and ecosystems -studies in Tibetan Plateau. Xiaolin Zhu zhu.381@osu.edu 11/05/2012 Geog 8901 class presentation . Introduction study area, phenology and detection by remote sensing Has the phenology changed during the past decades? Paper I (Piao et al., 2011)

E N D
Climate change and ecosystems-studies inTibetan Plateau Xiaolin Zhu zhu.381@osu.edu 11/05/2012 Geog 8901 class presentation
Introduction study area, phenology and detection by remote sensing Has the phenology changed during the past decades? Paper I (Piao et al., 2011) Did these changes relate to the climate change? Paper II (Shen et al., 2011) Conclusion and discussion Outline 1
A story and a lesson for publication • 2011. Piao et al.,Altitude and temperature dependence of change in the spring vegetation green-up date from 1982 to 2006 in the Qinghai-Xizang Plateau.Agricultural and Forest Meteorology, 151, 1599-1608. • 2007. Zhu, X. Study of the Altitude Dependence of Phenological Variation in Tibet-Qinghai Plateau, undergraduate thesis • 2011. Shen, M., Tang, Y., Chen, J., Zhu, X. and Zheng, Y. Influences of temperature and precipitation before the growing season on spring phenology in grasslands of the central and eastern Qinghai-Tibetan Plateau. Agriculture and Forest Meteorology, 151, 1711-1722. Be quick!!!
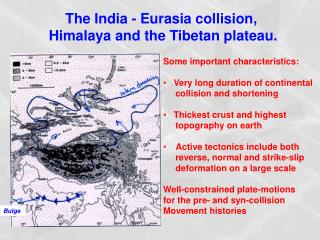
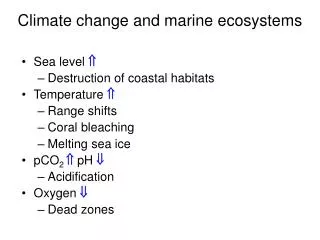
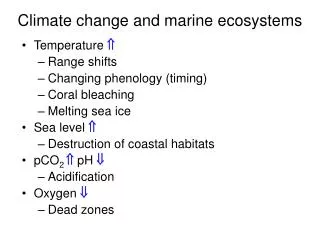
Introduction Study area: Tibetan Plateau
Introduction Study area: Tibetan Plateau 1) well known as “roof of the world” with an average of altitude over 4,000 m 2) annual mean temperature ranges from -9 to10 ℃ with an average of 3.9 ℃ 3) precipitation ranges from 100 to 1000 mm with an average of 483 mm and spatially descending from southeast to northwest 4) alpine meadow and alpine grassland cover more than 60% area
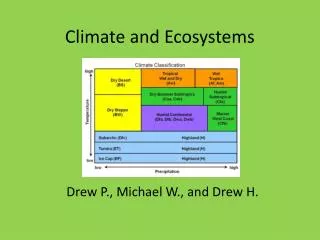
1.background Phenology: ‘‘the study of the timing of biological phases’’.
1.background Phenological changes: Historical observations, remote sensing, and ecosystem models agree on the fact that over the past several decades, a significant extension of vegetation growing season has been occurring in the northern regions, marked by both an earlier beginning and a later termination (Penuelas et al., 2002; Zhou et al., 2001; Piao et al., 2007)
1.background Phenology and climate Climate Phenology warming lengthens growing season (short time) extension of the growing season increases carbon sink (long time) 3
1.background Remote sensing in phenological studies 1) Global and Regional Scale 2) inter-annual and seasonal 3) AVHRR and MODIS VI product 4) Correlation to field observation
1.background Basic idea: Vegetation index from remote sensing shows the growing stages 4 key phenological phases of vegetation dynamics: (1) greenup; (2) maturity; (3) senescence; (4) dormancy; (5) growing-season length (GSL) Figure is from Zhang et al.(2003)
Paper I: : Phenological Variation • Piao et al., 2011. Altitude and temperature dependence of change in the spring vegetation green-up date from 1982 to 2006 in the Qinghai-Xizang Plateau.Agricultural and Forest Meteorology • Xiaolin Zhu. 2007. Study of the Altitude Dependence of Phenological Variation in Tibet-Qinghai Plateau, undergraduate thesis
Paper I: Phenological Variation 1. Introduction 1) In most temperate ecosystems where temperature is a key factor controlling phenology 2) global warming might show an altitude dependency 3) it is natural to ask the question whether the change of high altitude ecosystem function also exhibits an altitude dependency
Paper I: Phenological Variation 1. Introduction Questions: (1) What are the spatio-temporal patterns of spring vegetation green-up? How does the spring vegetation green-up change over the Qinghai-Xizang Plateau? (2) How does the spring vegetation green-up date and its temporal trends vary across an increasing altitude gradient? (3) How does the spring green-up date correlate with temperature? (4) How does the critical temperature threshold of the vegetation green-up onset respond to temperature changes?
Paper I: Phenological Variation 2. Methods and datasets Datasets: • 8 km × 8 km and 15-day interval were derived from NOAA/AVHRR series satellites from 1982 to 2006; • Daily mean temperature data recorded from 50 meteorological stations across the plateau for the period of 1982–2006
Paper I: Phenological Variation Meteorological stations
Paper I: Phenological Variation 2. Methods and datasets Analyses: • a linear regression using ordinary least squares. • In order to analyze changes in phenology at different altitudes, we calculated the average and standard deviation (SD) of vegetation green-up onset dates along the altitude gradient for every 100 m bin. • then analyzed the changes in the temporal trend of vegetation green-up date along the altitude gradient.
Paper I: Phenological Variation 3.Results and discussion 3.1. Spatial patterns of vegetation green-up The green-up date increases from west to east, reflecting spatial differences in climate and topography.
Paper I: Phenological Variation 3.Results and discussion 3.1. Spatial patterns of vegetation green-up the green-up date increases by 0.8 day per 100 m increase in elevation. Such delayed green-up in higher elevation tends to be more obvious in regions above 3600 m (1.1 days per 100 m).
Paper I: Phenological Variation 3.Results and discussion 3.2. Temperature thresholds for vegetation green-up vegetation in colder environments requires a lower threshold temperature to green up than in warmer areas.
Paper I: Phenological Variation 3.Results and discussion 3.3. Change in vegetation green-up date in the whole area
Paper I: Phenological Variation 3.Results and discussion 3.3.2. Spatial patterns of trends in vegetation green-up date (A) Trend in vegetation green-up from 1982 to 1999, (C) trend in spring temperature from 1982 to 1999
Paper I: Phenological Variation 3.Results and discussion 3.3.2. Spatial patterns of trends in vegetation green-up date (B) Trend in vegetation green-up from 1999 to 2006, (D) trend in spring temperature from 1999 to 2006
Paper I: Phenological Variation 3.Results and discussion • 3.3.3. Green-up trends in relation to elevation: in the whole Plateau (A) Trend in onset dates of vegetation green-up from 1982 to 1999 (B) trend in onset dates of vegetation green-up from 1999 to 2006
Paper I: Phenological Variation 3.Results and discussion 3.3.3. Green-up trends in relation to elevation: for each climate station (A) Trend in onset dates of vegetation green-up from 1982 to 1999 (B) trend in onset dates of vegetation green-up from 1999 to 2006
Paper I: Phenological Variation 3.Results and discussion 3.3.3. Green-up trends in relation to elevation: for each climate station (C) trend in spring temperature from 1982 to 1999 (D) Trend in spring temperature from 1999 to 2006 This result implies that these 50 climate stations are insufficient to well represent the altitudinal gradient of change in vegetation green-up date as well as temperature over the entire Plateau.
Paper I: Phenological Variation 4. Conclusion • both the spatial pattern and temporal change of spring vegetation green-up closely depends on altitude • Change in temperature likely function as the major controller for the spatio-temporal patterns of the vegetation green-up dates in the Qinghai-Xizang Plateau • Positive correlation between temperature critical threshold of vegetation green-up and MAT implies potential vegetation adaptation in warmer climate • these 50 climate stations are insufficient to well represent the spatio-temporal change of vegetation green-up date as well as temperature over the entire Qinghai-Xizang plateau
Paper II: Influences of Climate 2011. Shen, M., Tang, Y., Chen, J., Zhu, X. and Zheng, Y. Influences of temperature and precipitation before the growing season on spring phenology in grasslands of the central and eastern Qinghai-Tibetan Plateau. Agriculture and Forest Meteorology, 151, 1711-1722. What is the difference from the paper I: • Consider both temperature and precipitation; • Dig more information from the climate data
Paper II: Influences of Climate 1. Introduction • the timing of spring phenological events under the current warming climate differed in magnitude and even in direction (i.e., advance vs. delay in the date) among species and areas • the underlying mechanisms responsible for these shifts have been scarcely explored.
Paper II: Influences of Climate 1. Introduction • In temperate zones, vegetation does not begin to grow again until a certain cumulative temperature above a threshold • In addition, water availability is one of the critical environmental factors that regulate vegetation activities in many areas such as arid and semiarid grasslands
Paper II: Influences of Climate 1. Introduction Objective: aims to untangle how changes in spring temperature and precipitation influence the spring phenology of grasslands on the plateau
Paper II: Influences of Climate 2. Materials and methods 2.1. Study area
Paper II: Influences of Climate 2. Materials and methods 2.2. Detection of green-up onset from satellite images Data: 8 km AVHRR NDVI from 1982 to 2006 (same as paper I) Method: logistic function method (Zhang et al., 2003)
Paper II: Influences of Climate 2. Materials and methods 2.3. Climatological variables daily surface air temperature and precipitation data from 50 meteorological stations
Paper II: Influences of Climate 2. Materials and methods 2.3.1. Holdridge aridity index Holdridge aridity index (HAI) is an index of the potential evapotranspiration rate, and is defined as the ratio of the bio-temperature to the annual precipitation
Paper II: Influences of Climate 2. Materials and methods 2.3.2. Thermal spring onset date thermal spring onset date (TSO), which is based on the cumulative temperature above a threshold temperature that defines when green-up can potentially begin. How to decide time span : maximizing the correlation between GUD and TSO GUD time span
Paper II: Influences of Climate 2. Materials and methods 2.3.3. Preseason precipitation the cumulative preseason precipitation (PPT), which was found to be negatively correlated with GUD How to decide time span: minimizing the correlation between GUD and PPT GUD time span
Paper II: Influences of Climate 3. Results 3.1. Correlation between GUD and preseason temperature The grass in warmer and lower area needs more energy to green-up.
Paper II: Influences of Climate 3. Results 3.1. Correlation between GUD and preseason temperature GUD for about 80% of the stations tended to be affected by temperatures within 5 weeks before the onset of green-up.
Paper II: Influences of Climate 3. Results 3.1. Correlation between GUD and preseason temperature GUD was more strongly related to TSO in areas with a lower HAI. GUD in humid area more related to temperature! (C) Coefficients of correlations between GUD and TSO (r(GUD, TSO)) along a spatial gradient of the Holdridge aridity index (HAI)
Paper II: Influences of Climate 3. Results 3.1. Correlation between GUD and preseason precipitation GUD at 32 out of the 50 stations was negatively correlated with PPT within the 30 days
Paper II: Influences of Climate 3. Results 3.1. Correlation between GUD and preseason precipitation There was a weak but statistically significant (P < 0.01) decreasing trend in the correlation coefficient as a function of HAI GUD in humid area less related to precipitation! (C) Coefficients of correlations between GUD and PPT (r(GUD, PPT)) as a function of the Holdridge aridity index (HAI)
Paper II: Influences of Climate 3. Results 3.2. Inter-annual variations in green-up onset and TSO days at a regional scale an advancing trend since 1982, despite a sharp delay in 2000 and 2001. advanced by 9.9 days from 1982 to 1999 Interannual variations in green-up onset date (GUD) and thermal spring onset date (TSO) averaged for the meteorological stations. The positive r values represent Pearson’s coefficient of correlation between GUD and TSO, and the negative r values in bold are Pearson’s coefficient of correlation between GUD and preseason precipitation (PPT).
Paper II: Influences of Climate 3. Results 3.3. Spatial patterns of the shifts in TSO and GU On average, the grasslands experienced a delay of 3.3 days in GUD from 1982 to 2006, but with an advance of 9.6 days from 1982 to 1999 and a delay of 7.2 days from 1999 to 2006. Spatial patterns in the trends (day/year) of green-up onset date (GUD) and thermal spring onset date (TSO) from 1982 to 2006
Paper II: Influences of Climate 3. Results 3.3. Spatial patterns of the shifts in TSO and GUD Relationships between the trends for green-up onset date (GUD) and thermal spring onset date (TSO) from 1982 to 2006
Paper II: Influences of Climate 4. Discussion 4.1. the effects of preseason temperature and precipitation on the onset of green-up • spring green-up of the vegetation in warm areas requires a higher cumulative temperature than in cold areas • Vegetation adaption? Additional research will be required to determine whether this result indicates that the onset of green-up at a given location will require an increased cumulative temperature as the climate grows warmer.