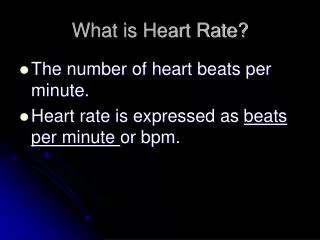
Analyzing Heart Rate Data for Exercise Effects
160 likes | 268 Vues
Explore a dataset on heart rate changes before and after exercise to understand relationships and statistical insights. Calculate statistics on Excel, interpret central tendencies and spread, and visualize with appropriate graphs. Evaluate the study's methodology and potential limitations.

Analyzing Heart Rate Data for Exercise Effects
E N D
Presentation Transcript
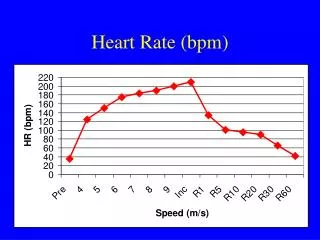
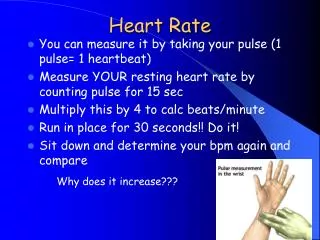
Some of the ‘Heart Rate’ Data • Take a look at the data so you have some ideas to start with. • Get an idea about the type of question you might like to answer.
Possible questions • Is there a relationship between the number of beats/min before and after the students had stepped up and down on a block of a fixed height? • How does the heart rate change after exercising?
Comment on the statistics • Comment on the Central Tendencies:
Comment on the statistics • The mean increased by 26.3 beats/min but the median increased by 18 beats/min. This suggests that there are extreme values and the median would be a better measurement an ‘average’ increase. • The mode has little meaning in this context.
Comment on the statistics • Now comment on the spread.
Comment on the statistics • The range of values for the final increased by 42 (probably due to extreme values). • The IQR would give a better measure of spread as the increase was only 12.
Appropriate graphs • If we are comparing values, a box and whisker plot would show this.
Comments • These plots show that there has been a marked increase in heart rate after the exercise. • All three measures: Median, LQ and UQ have increased. • As the boxes do not overlap, the increase can be considered to be significant.
Comments • Both the range and interquartile range have increased showing an increase in the spread of the data.
If you are looking for a relationship between variables a scatterplot shows the relationship.
If you are looking for a relationship between variables a scatterplot shows the relationship. • The relationship between resting and final heart rate is a positive linear relationship. • The gradient of the line suggests that we could expect on average a 1.12 beats/min increase in heart rate for every 1 beat/min increase in the resting heart rate.
Evaluation • 30 volunteers were found from among the student’s friends. • Because the survey was done using volunteers, it may not represent the population as a whole. • The student’s friends may be more or less physically able than the general student population.