COUNTRY PROJECT Presentations
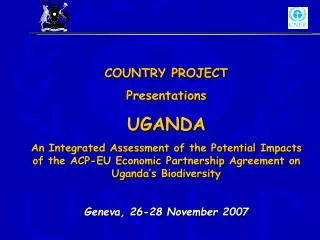
COUNTRY PROJECT Presentations Integrated Assessment of Trade-Related Policies in the Agriculture Sector and Biological Diversity: Papua New Guinea Project Geneva, 1-3 July 2008. OBJECTIVE OF THE ASSESSMENT.

COUNTRY PROJECT Presentations
E N D
Presentation Transcript
COUNTRY PROJECT Presentations Integrated Assessment of Trade-Related Policies in the Agriculture Sector and Biological Diversity: Papua New Guinea Project Geneva, 1-3 July 2008
OBJECTIVE OF THE ASSESSMENT To create the necessary support and capacity in PNG for planning and implementing sustainable national economic development and poverty reduction while strengthening the maintenance of biodiversity. • A critical area is to enhance capacity to assess, design and implement agricultural trade-related and trade liberalization policies that support these national objectives using the example of the maintenance of staple food crop biodiversity.
OBJECTIVE OF THE ASSESSMENT A number of sequential objectives the project aims to achieve are: • Building of national capacity to assess the environmental, social, and economic impacts of the tariff reduction programme, with emphasis on impacts on biodiversity, including sweet potato and taro varieties as the case study. • Building of capacity among trade negotiators and policy makers to facilitate sustainable agriculture trade.
OBJECTIVE OF THE ASSESSMENT • Enhancing understanding of the factors leading to loss of agro-biodiversity as a consequence of the tariff reduction policy and other trade instruments. • Develop integrated assessment methods and biodiversity indicators, especially indicators of food crop genetic erosion, for on-going use. • Building of capacity to develop and implement integrated national responses to the results of this pilot project. • Engage the integration of concepts and requirements for the sustainable management of agro biodiversity into EU-ACP and other trade negotiations. • Enhancing civil society engagement in PNG in assessment and policy making, and in sustaining agro-biodiversity.
SPECIFIC OBJECTIVE OF THE ASSESSMENT • The specific objective is to understand the impact of trade liberalization on agriculture sector, particularly the changes in export crop sector and its impact on semi-subsistence or staple food sector and it’s biodiversity. • This is particularly done through collecting relevant indicators of biodiversity such a land conversion, land use systems, population dynamics, food consumption patterns and changes, and attempting to trace these effects to the implementation of the tariff reduction. The lessons learnt could be applied to the environment in general and other biodiversity in particular.
FOCUS OF THE ASSESSMENT • The focus of the study is to assess how the Tariff Reduction Program (TRP) has affected and will affect the export cash crop sector and the semi-subsistence crop sector and how this in turn will affect biodiversity of taro and sweet potato. • Particularly it will look at how the export crop sector and the subsistence crop sector have been changing in reference to the introduction of TRP. It will be looking at changes in land area for the export crops and the subsistence crops. • The analysis will revolve around whether cash crop area expansion is taking place at the cost of subsistence crop area or forest land area. The type of land on which cash crops are expanding would have important implications for agriculture and food crop biodiversity, the environment and for different types of biodiversity. This sets the basis for exploring the relationship between changes in agricultural production and land use and biodiversity. Export figures, value of export crops, and imported food substitutes will be used either as ‘mirror’ analysis of impact of tariff on food biodiversity or as other dimensions of tariff.
FOCUS OF THE ASSESSMENT • The main sector this project is focusing on is the food crop sector since that (1) currently it has no direct link to trade, and (2) that food crop and export crop compete for land. • The project is assessing the trickle down effect (impact) of trade on food crop sector extending from export crop sector. The concept of impact assessment of biodiversity is encompassed in the food-crop biodiversity. Because of the technical difficulties involved in assessing the whole biodiversity, assessment of food-crop biodiversity is designed to be used as a surrogate.
FOCUS OF THE ASSESSMENT Semi-subsistence Sector • The food crop semi- subsistence sector consists primarily of garden crops ranging from sweet potato, banana, taro, yam, a wide range of leafy vegetables to a limited stock of introduced grain crops, among countless others. Although intensity of staple diet may vary from region to region, nationally sweet potato is the most dominant staple.
FOCUS OF THE ASSESSMENT Sweet Potato • Sweet potato is predominantly grown in the Highlands region - - where 40% of the population lives. • Coffee is also the predominant cash crop in the Highlands • sweet potato is also fast becoming a commercial crop.
FOCUS OF THE ASSESSMENT Taro • Taro is important as food to PNG culture, genetic diversity, food security, climate and geographic suitability and economy. • For decades, taro has been the third most important indigenous staple in PNG, after sweet potato and banana. • 436,000 tonnes of taro are produced annually on an area of 77,000 hectares • Taro is considered to be a very ancient crop in PNG • PNG now has the world’s largest genetic diversity of taro. • Today, taro is grown in all the lowland parts of PNG, and it performs best in these lowland locations.
Region (Eastern Highland and WNB) West New Britain Eastern Highlands
CONCEPTUAL FRAMEWORK • Main Driving force (i.e. trade policy or measure). • Export-Driven Economic growth is the main policy drive influencing trade policy and domestic trade and business structure. • One notable trade measure is Tariff Reduction Program How it would affect the agricultural sector and the target commodity. This measure has and will affect the agriculture sector by making it more competitive. • Reduction of input cost. • Relieve those agriculture industries that are ‘negatively protected’. • Improved income might lead to expansion of crop production (area and/or volume). • Substitutes of staple food imported compete with local food production.
CONCEPTUAL FRAMEWORK The likely changes in incentives in the agriculture sector and in land use. (1) Conversion of forest land. (2) Conversion of subsistence garden land. (3) If (2) holds further conversion of forest land for subsistence garden results. (4) Overuse of land or intensification of land leads to degraded quality of land.
CONCEPTUAL FRAMEWORK Impacts on the environment, biodiversity and the ecosystem services associated with biodiversity. • Limited garden land available limits farmers choice of keeping a wide range of food crop varieties leading to loss of diversity. • Forest Conversion leads to (2a) erosion of forest food plants (2b) erosion of other biodiversity and ecosystems services. • Market preferred varieties of food crop (introduced + traditional) lead to loss of other varieties . • Imported substitutes of staple foods (rice & wheat) compete with staple food and lower demand for local food production leading to loss of biodiversity.
METHODOLOGY The baseline for the analysis of impacts. Sweet potato varieties Taro varieties Land use system Other biodiversity - The policy scenarios used.
METHODOLOGY Economics Indicators Export Share of GDP Export Share of Agriculture Export Share of coffee and palm oil Import volume and value of farm inputs Tariff figures – type, level Employment share of agriculture Employment figure of Agriculture Employment share of coffee and oil palm Share of household income from agriculture Share of household income from coffee and palm oil Measure of producer surplus of farm outputs (oil palm and coffee) Measure of consumer surplus for imported and staple foods Benefit cost measure using producers and consumer surpluses
METHODOLOGY Social Indicators Social services (Road, Health) Nutrition and diet figures
METHODOLOGY • Environmental (+agricultural biodiversity) • Land area under export sector crop • Land area under coffee and oil palm industries • Land area under semi-subsistence crop • Land area under sweet potato and taro • Inventory of sweet potato and taro varieties • Potential growing areas of taro and sweet potato using GIS mapping tool. • Import figures of fertilizers, insecticides, and tractors and tractor accessories • Rate of usage of agricultural chemicals • Sweet potato biodiversity indicator measure • Taro biodiversity indicator measure
METHODOLOGY • Environmental (+agricultural biodiversity) • ‘wild’ taro biodiversity indicator measure • ‘wild’ sweet potato biodiversity indicator measure • ‘Other’ biodiversity indicator measure • value of biodiversity indicators to farmers • latent and apparent diversity concept • Spatial diversity concept • Index of plants, insects, birds and animals of value (to farmers) disturbed. • Amount and level of conservation effort practiced
METHODOLOGY (cont.) • Field Survey Sampling Methods • Stratified random sampling method has been adopted, and the strata identified are • population density, • accessibility to road (market), • accessibility to other social services (e.g. health), • income level, • intensity of coffee /oil palm activity, and • intensity of subsistence farming;
ASSESSMENT OF IMPACTS In Progress …But…
SOME BASELINE INFORMATION – FOOD CROP GENETIC STOCK/COLLECTIONS
FOOD CROP GENETIC COLLECTIONS • Not representative of the whole country • No cross-checking of the collection against what the farmers have in the field
SOME BASELINE INFORMATION (COFFEE) • Price of coffee has increased from about 2000 PGK to 8000 PKG per ton between 1990 and 2007 • Volume of export has been steady at around 60 000 tonnes between the same period.
SOME BASELINE INFORMATION (OIL PALM) • Oil Palm price has increased from about 300 PGK to about 2000 PKG per tone for the same period, • while the volume of export increased slightly on a steady rate from 200 thousand to just over 300 thousand tonnes
SOME BASELINE INFORMATION (AGRICULTURE EMPLOYMENT) • Agriculture employment decline in the Highlands around the year 1997. An important link to food security issue (Top Fig). • Agriculture employment increased from about the same time for the Island region • There must have been an outmigration of labour from the highlands to the islands (or coastal) region.
SOME BASELINE INFORMATION (RICE CONSUMPTION AND PRODUCTION) • Consumption per capita of rice has increased steadily between 1960 and 2000 (top fig) • Local rice production has been very low and erratic, averaging at about 4% of the total rice consumed.
SOME BASELINE INFORMATION (LAND USE CLASSIFFICATION AND INTENSITY) • Land use – current data is very sparse • LU0 = land with very high intensity tree crops • LU1 = very high intensity of food crop, high pop density, and permanent agriculture, cultivation cycle of over five years • LU2 = high intensity land use, food production as the primary base in densely populated areas • LU3 = moderate intensity, food production, moderate density, with short to moderately long fallow periods. • LU4 = low intensity, common in low pop density mainly in coastal regions and some part of highlands, and moderately long periods Source: Saunders, 1993 • LU5 and LU6 = Very low intensity, very low population density, esp. in low land areas where alternative food (e.g., sago and fish) supplement cultivated food, and where gardens are scattered are widely scattered
SOME BASELINE INFORMATION (POPULATION DYNAMICS) • PNG’s population grow exponentially between 1972 and 2007, from approximately 2.7 million to 5.6 million. • Population densities varies greatly with altitude, with the highest population densities occurring in the highlands region at elevation of between 1500 – 3000 m • Current population growth rate is 2.3% pa. • Food production growth rate is 1.2% pa.
COMMENTS FROM STAKEHOLDERS MEETINGS • How climatic change contributes to erosion of genetic biodiversity. Look at other trade policy apart from TRP and relate to Biodiversity (DEC). • Recommend for further studies –other biodiversity • Look at policies and link the project back to policies • Link the project to NADP and establish ‘nature sanctuaries’ • Land Use Planning in relation to the project (Petra) • Land use can be controlled on state land, but would be very difficult on native land (DEC) • Farmers preferences in growing what crop species for income earning opportunities depends on local market demands and responses (Petra)
COMMENTS FROM THE STAKEHOLDERS MEETINGS (cont.) • TRP-Special Products List (SPL) includes taro and sweet potato ] • Possibility for export to Australia and NZ under the PACER arrangements • Look at the use of Agric inputs (chemicals, machinery etc.) before and after Trade Liberalization • TRP has impacted on local vegetable (introduces species) production. Increase production of cabbages, broccolis, carrots, English potatoes etc • Bring in couple of land use ‘indicators’. Traditional farming VS Commercial farming and how this will affect biodiversity. (Base line studies) • DAL land use section to find out land use patterns. • Trade Policy should take into consideration “Domestic Trade” of food crops as well
POSSIBLE POLICY RECOMMENDATIONS AREAS • Development of ‘sanctuaries’ for food crop plant genetic resources (Links-Carbon Trade, NADP, DEC, BPNGSAP, Trade, Land Program) • Regulations on usage of agricultural inputs (organic farming, faire trade), • Guidelines on agricultural land conversions (land reform program) • Development of improved farming systems • Tariff quota on import of grain food to be considered on reasonable grounds • Promote downstream processing of staple crops( e.g., taro ice cream) • Agricultural incentives to be offered only on reasonable grounds • Promote plantation foresting • Designing biodiversity preservation (environmental) tax on the export of agricultural and timber products and use the proceeds to implement biodiversity preservation plans. • A clear land use guidelines for Papua New Guineans
POSSIBLE POLICY RECOMMENDATIONS AREAS (cont.) • Develop a policy on domestic trade based on regional (provincial) endowment of staple crops and other natural resources. • Integrate agriculture and population policy to achieve a population growth rate that is below the food production growth rate. • Integrate agriculture, food security and health and nutrition polices especially HIV/AIDs policies to develop nutritional foods from staple foods that can sustain people living with HIV/AIDS, • Trade negotiators and market agricultural market innovators to explore and negotiate markets for traditional food, art, craft, and others that will sustain the interest of preserving and managing the biodiversity on sustainable basis.
NEXT STEPS Brief Description - the next steps in project implementation planned for the coming months.
ACHIEVEMENTS • Policy Reviews • Conceptual Development • Indicators and Criteria • Methodology Development • 2nd NSC Meeting • 1st National Review Meeting
CHALLENGES • Complexity of the project • Non-availability of secondary data • Socio-cultural difficulties in collecting primary data • Indifferent attitudes from line deparments/agencies