Download
1 / 19
240 likes | 529 Vues
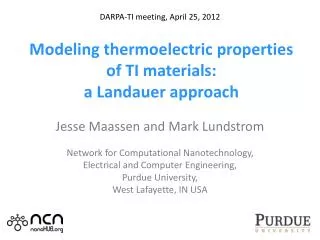
DARPA-TI meeting, April 25, 2012. Modeling thermoelectric properties of TI materials: a Landauer approach. Jesse Maassen and Mark Lundstrom. Network for Computational Nanotechnology, Electrical and Computer Engineering, Purdue University, West Lafayette, IN USA. Overview. Motivation.

E N D
DARPA-TI meeting, April 25, 2012 Modeling thermoelectric properties of TI materials: a Landauer approach Jesse Maassen and Mark Lundstrom Network for Computational Nanotechnology, Electrical and Computer Engineering, Purdue University, West Lafayette, IN USA
Overview • Motivation. • Summary of the thermoelectric effect. • Thermoelectric modeling within the Landauer approach. • Example: effect of TI surface states on the thermoelectric properties of Bi2Te3 films.
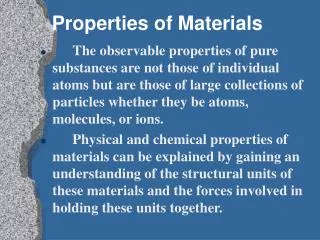
Motivation • In recent years, much research has focused energy-related science and technology, in particular thermoelectrics. • Some of the best known thermoelectric materials happen to be topological insulators (e.g., Bi2Te3). • Work has appeared showing that TI surface states in ultra-thin films (<10 nm) can lead to enhanced thermoelectric properties. ZT ~ 2 P. Ghaemiet al., Phys. Rev. Lett. 105, 166603 (2010). ZT ~ 7 F. Zahid and R. Lake, Appl. Phys. Lett. 97, 212102 (2010). Next step is to reproduce and perhaps expand these results.
Overview of thermoelectric effect G: Electrical conductance S: Seebeck coefficient κ0: Thermal conductance (electronic contribution) Electric current: Heat current: External parameters Material properties Thermoelectric efficiency ΔT = T1 – T2 T2 T1 Ie IQ V1 V2 ΔV = V1 – V2
Overview of thermoelectric effect G: Electrical conductance S: Seebeck coefficient κ0: Thermal conductance (electronic contribution) Electric current: Heat current: Seebeck (S) : factor relating ΔT to ΔV (zero current). Material properties Peltier (Π) : factor relating Ie to IQ (zero T-gradient). ΔT = T1 – T2 T2 T1 Ie IQ V1 V2 ΔV = V1 – V2
Electronic transport in the Landauer picture I e- e- Device/structure Reservoir in thermodynamic equilibirum Reservoir in thermodynamic equilibirum • Electrons flow when there is a difference in carrier occupation (f1 and f2). • Carriers travel through the device region both elastically and ballistically(i.e. quantum transport).
Electronic transport in the Landauer picture • Non-equilibrium transport • Near equilibrium (linear response) • Differential conductance (energy-dependent G) • Average transmission times the number of conducting channels (Ballistic)
Diffusive transport in the Landauer picture Scattering Band structure : Mean-free-path for backscattering • Average mean-free-path times the number of conducting channels per unit area.
What is M(ε)? • M(ε) is the number of conducting channels. • One band = One mode for conduction (“band counting” method). • Roughly corresponds to number of half-wavelengths that fit in cross-section. • Each mode contributes a conductance of G0. Courtesy of ChangwookJeong M(ε,k) Si Fermi surface In 2D or 3D, the “band counting” method for applies to every transverse k-state.
Effect of dimensionality on M(ε) • Parabolic bands 1D: 2D: 3D: S. Kim, S. Datta and M. Lundstrom, J. Appl. Phys. 105, 034506 (2009).
Thermoelectric transport coefficients Physically intuitive form (assuming constant λ0): Conductivity Seebeck Electronic thermal conductivity (zero field) Lattice thermal Conductivity (phonon) Electronic thermal conductivity (zero current)
Lattice thermal transport within Landauer • Lattice / phonon transport is the same as electron transport within the Landauer approach. • In principle, one can utilize the Landauer model to perform a complete assessment of thermoelectric performance (electron + phonon). • Figures: Bi2Te3 phonon modes (top) and lattice thermal conductivity (bottom). [Courtesy of ChangwookJeong] Mph (1018 m-2) THz (s-1) κph (Wm-1K-1) T (K) [Courtesy of ChangwookJeong]
Example: TI states in Bi2Te3 films Estimate impact of TI surface states on the thermoelectric characteristics of variable thickness Bi2Te3 films. • Electronic states of film: sum of bulk Bi2Te3 states (varying with tfilm) and TI surface states (independent of tfilm). • Bulk states calculated from first principles. • TI surface states approximated by analytical expression. • Neglect TI/bulk and TI/TI hybridization.
Bulk states Band structure Good comparison with experiment using constant MFP. Deeper in CB Scattering Deeper in VB Exp. data: Proc. Phys. Soc. 71, 633 (1958).
TI surface states Dispersion of TI state Analytical model: Alignment of TI surface state relative to bulk Bi2Te3 taken from exp. study. [Y. L. Chen et al., Science 325, 178 (2009)]. vk = 2.55 eV Å λ = 250 eV Å3 [L.Fu, Phys. Rev. Lett. 103, 266801 (2009)] Distribution of modes (TI state) Iso-energy of TI state Shape of the Fermi surface confirmed experimentally [Y. L. Chen et al., Science 325, 178 (2009)]. Distribution of modes is linear in energy. λ is taken to be 100 nm [F. Xiuet al., Nature Nano. 6, 216 (2011)].
Conductivity (TI + bulk states) Sheet conductivity • Conductivity > 10x σBulk at tfilm = 10 nm. • Significant difference between film and bulk σ at tfilm =100 nm. • Surface conduction largest in bulk band gap. • Large fraction of surface conduction for n-type (exp. EF @ 0.05 eV above CB*). * Y. L. Chen et al., Science 325, 178 (2009).
Seebeck coefficient (TI + bulk states) S weighted by conductance • Max. Seebeck reduced ~35% @ 100nm and ~70% @ 10nm. • Effect of TI surface state observed at 1µm. • How do results change with λsurf? tfilm = 10 nm tfilm = 100 nm • When λsurf decreases 10x, S increases < 2x. • Decreasing λsurf one order of magnitude is equivalent to increasing tfilm by the same factor.
Power factor (TI + bulk states) • Significant reduction in power factor with the presence of TI surface states. • Aside from conductivity, all thermoelectric characteristics are degraded with the surface states. • Hinder surface conduction by enhancing scattering or destroying the surface states. Surface roughness or adding magnetic impurities may enhance thermoelectric performance.
Conclusions • Landauer approach is a powerful formalism for calculating the thermoelectric coefficients of materials, particularly when combined with full band descriptions of electronic dispersion. • This method naturally spans from ballistic to diffusive transport regimes and considers bulk and nano-scale systems. • Within our example, TI surface states were shown to degrade the thermoelectric performance of Bi2Te3 films (when the thickness is large enough to form a gap in the TI states). • Hindering surface conduction may enhance thermoelectric performance, e.g. introducing surface roughness and/or magnetic impurities.