Advancements in Cell Cycle Modeling: Insights from Saccharomyces cerevisiae
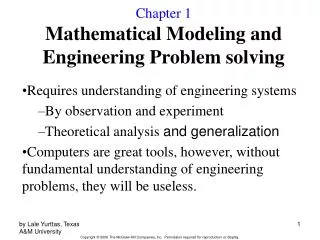
This work focuses on the application of molecular cell biology in modeling the cell cycle of budding yeast (Saccharomyces cerevisiae). Through the integration of ordinary differential equations (ODEs), we describe protein concentration changes and their interactions within the G1, S, G2, and M phases. Our goal is to enhance modeling efficiency, aiming for daily model updates instead of monthly. We introduce the JigCell software platform, featuring components such as the Model Builder and Run Manager, facilitating the simulation and analysis of genetic mutations and cell behavior.


Advancements in Cell Cycle Modeling: Insights from Saccharomyces cerevisiae
E N D
Presentation Transcript
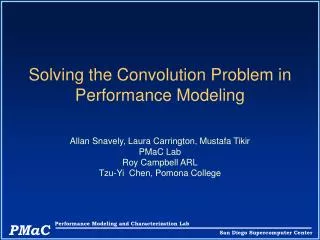
Pathway Modeling andProblem Solving Environments Cliff Shaffer Department of Computer Science Virginia Tech Blacksburg, VA 24061
Application:Cell Cycle Modeling • How do cells convert genes into behavior? • Create proteins from genes • Protein interactions • Protein effects on the cell • Our study organism is the cell cycle of the budding yeast Saccharomyces cerevisiae.
G1 cell division S DNA replication M (mitosis) G2
Pds1 Esp1 Esp1 Sister chromatid separation unaligned chromosomes SBF Cdh1 Pds1 Mcm1 Cdc20 PPX Net1P Tem1-GDP Cdc15/MEN Lte1 Bub2 Tem1-GTP Net1 Cdc14 RENT Sic1 Sic1 P Mcm1 Cdh1 Cdc20 Cln2 Clb2 Clb5 Mitosis Mad2 growth APC-P unaligned chromosomes Mcm1 Cdc20 Cdh1 Clb2 APC Inactive trimer Cdc14 and Cln3 Swi5 CDKs SCF P Cdc14 Bck2 Inactive trimer ? MBF Clb5 DNA synthesis Clb2 SBF Cln2 Budding
Modeling Techniques • One method: Use ODEs that describe the rate at which each protein concentration changes • Protein A degrades protein B: … with initial condition [A](0) = A0. Parameter c determines the rate of degradation. • Sometimes modelers use “creative” rate laws to approximate subsystems
synthesis synthesis binding degradation degradation inactivation activation Mathematical Model
G1 S/M Simulation of the budding yeast cell cycle mass CKI Cln2 Clb2 Cdh1 Cdc20 Time (min)
k1 = 0.0013, v2’ = 0.001, v2” = 0.17, k3’ = 0.02, k3” = 0.85, k4’ = 0.01, k4” = 0.9, J3 = 0.01, J4 = 0.01, k9 = 0.38, k10 = 0.2, k5’ = 0.005, k5” = 2.4, J5 = 0.5, k6 = 0.33, k7 = 2.2, J7 = 0.05, k8 = 0.2, J8 = 0.05, … Parameter values Differential equations Experimental Data
Tyson’s Budding Yeast Model • Tyson’s model contains over 30 ODEs, some nonlinear. • Events can cause concentrations to be reset. • About 140 rate constant parameters • Most are unavailable from experiment and must set by the modeler
Fundamental Activities • Collect information • Search literature (databases), Lab notebooks • Define/modify models • A user interface problem • Run simulations • Equation solvers (ODEs, PDEs, deterministic, stochastic) • Compare simulation results to experimental data • Analysis
Our Mission: Build Software to Help the Modelers • Typical cycle time for changing the model used to be one month • Collect data on paper lab notebooks • Convert to differential equations by hand • Calibrate the model by trial and error • Inadequate analysis tools • Goal: Change the model once per day. • Bottleneck should shift to the experimentalists
Another View • Current models of simple organisms contain a few 10s of equations. • To model mammalian systems might require two orders of magnitude in additional complexity. • We hope our current vision for tools can supply one order of magnitude. • The other order of magnitude is an open problem.
JigCell Current Primary Software Components: • JigCell Model Builder • JigCell Run Manager • JigCell Comparator • Automated Parameter Estimation (PET) • Bifurcation Analysis (Oscill8) http://jigcell.biol.vt.edu
Model Builder Optimum Parameter Values Parameter Values Run Manager Comparator Parameter Optimizer
JigCell Model Builder • From a wiring diagram…
JigCell Model Builder • …to a reaction mechanism N.B. Parameters are given names, not numerical values! … to ordinary differential equations (ode files, SBML)
Mutations • Wild type cell • Mutations • Typically caused by gene knockout • Consider a mutant with no B to degrade A. • Set c = 0 • We have about 130 mutations • each requires a separate simulation run
Derived Set (mutant A) Derived Set (mutant B) Derived Set (mutant C) Derived Set (mutant A’) Derived Set (mutant AB) Derived Set (mutant A’C) Basal Set (wild-type) Run Manager • Inheritance patterns
Phenotypes • Each mutant has some observed outcome (“experimental” data). Generally qualitative. • Cell lived • Cell died in G1 phase • Model should match the experimental data. • Model should not be overly sensitive to the rate constants. • Overly sensitive biological systems tend not to survive
Comparator • Visualize results Kumagai1 Kumagai2