Download
1 / 27
270 likes | 569 Vues
The development of an FTIR function for tracking bud dormancy in kiwifruit. Murray Judd, Denny Meyer, John Meekings, Annette Richardson and Eric Walton. Summary of Presentation. Introduction to the problem Relevant recent research The aims of this research FTIR spectroscopy

E N D
The development of an FTIR function for tracking bud dormancy in kiwifruit Murray Judd, Denny Meyer, John Meekings, Annette Richardson and Eric Walton
Summary of Presentation • Introduction to the problem • Relevant recent research • The aims of this research • FTIR spectroscopy • The experimental context • Statistical Methodology • Results • Conclusions
The problem • Many deciduous perennial fruit crops require winter chilling for adequate bud break and flowering. • Global warming is often making it necessary for chemicals to be used for this purpose. • Optimum timing and concentrations for application of these chemicals is not known, because there is no way of knowing what is happening inside the buds until they burst. Buds are inscrutable.
Relevant Recent Research • Richardson et al (2007) have shown that changes in sugar and amino acids are associated with the release of kiwifruit buds from dormancy. • Wang and Buta (1997) have shown that FTIR spectroscopy is a useful tool for examining biochemical changes in blueberry flower buds
The Aims of This Research • Develop a function which tracks the release of kiwifruit buds from dormancy using FTIR spectrometry. • Actinidia deliciosa (A. Chev.) C.F. Linf et A.R. Ferguson var. deliciosa ‘Hayward’ • Suggest how this function can be used to improve our understanding of the influence of various environmental and physiological factors on the breaking of bud dormancy.
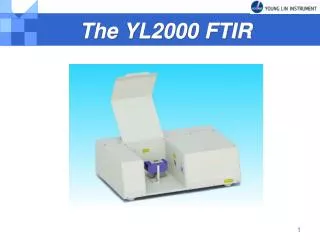
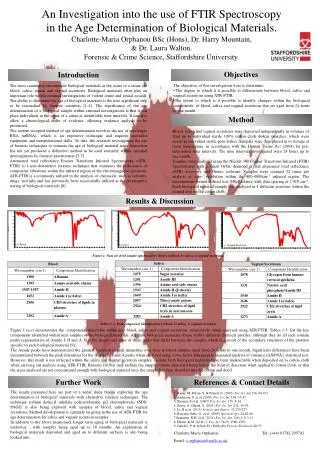
Fourier Transform Infrared (FTIR) Spectroscopy • An FTIR spectrum consists of absorption peaks that correspond to the vibrations between the bonds of atoms that make up a material. • FTIR spectroscopy is commonly used to identify unknown materials using known spectral signatures.
Advantages of FTIR Spectroscopy • A good track record • A reliable and fast method for detecting structural and compositional changes in fruit. • A practical solution for kiwi fruit growers because • FTIR equipment is relatively cheap and common • Sample preparation is relatively simple.
Specific Objectives in this Research • Find a time varying FTIR signature that will provide a stable indicator of changes in bud dormancy across sites and seasons that is strongly correlated with • Soil temperatures • Sucrose levels • Treatment (Hydrogen Cyanamide (HC)?).
Technical Problems in this Research • Chemically we do not have a spectral signature to search for because we do not know the critical compounds that are changing during bud dormancy. • Active part of the spectrum consists of 600 wave numbers making multivariate methods essential
The Experimental Context 2001 • The research was conducted at Plant & Food Research Ruakuru in 2001 using buds collected • At four NZ locations (Kerikeri, Waikato, Te Puke, Nelson) • At roughly 14 day intervals: some HC treated, others not • Sample preparation described by Walton et al (1997) • 10 replicates each consisting of 5 meristems for both FTIR and sugar analyses (Richardson et al, 2007) • FTIR spectrometer fitted with an Attenuated Total Reflectance (ATR) zinc selenide accessory produced data for the 600 wave numbers considered.
The Experimental Context 2002 • The research was repeated at Plant & Food Research Ruakuru in 2002 but • there was no data for Nelson • the FTIR spectra were only available at half the spectral resolution (i.e. 300 wave numbers considered)
Statistical Methodology • Principal Component Analysis for data reduction purposes • Creation of a grouping variable to differentiate between sites, treatment and day of the year. • Canonical discriminant analysis based on PC scores • Choice discriminant function for training data based on • Similar evolution over time for all sites • Separation between HC-treated and untreated vines • Stepwise regression to find critical FTIR wave numbers
Regression Function: Validation • Consistent patterns of behaviour for 2001 test data and for 2002 • Similar evolution over time for all sites • Separation between HC-treated and untreated vines • Consistent correlations with • Sugar concentrations • Air and soil temperatures for untreated vines.
Results • 12 principle components explained 99% of the variation in the FTIR spectra • Canonical discriminant analysis for these 12 components produced four discriminant functions that differentiated between the different categories of the grouping variable. • One of these functions differentiated between the sites while another appeared to evolve in a similar fashion over time for each site while differentiating between HC treated and non-treated vines.
Forward Stepwise Regression • 10 wave number required to explain 98% of the variation in the bud development function. • Interpretation of wave numbers is difficult because • These wave numbers represent a band of wave numbers. • The sugars in the meristems may be physically different from standard sugars.
Chemical properties of important wave numbers • Further work is required for a full interpretation of the bud development function using these wave numbers but the following changes are likely:- • Sucrose decline at wave numbers 924cm-1 and 1042cm-1 • Fructose decline at wave number 1064cm-1 • Cellulose increase at wave number 1369cm-1 • Saturated esters increase at 1744cm-1 • Tewari and Malik (2007), Cerna et al (2003), Hinteroisser et al (2001), Wang et al (2003).
Validation of bud development function using sugar correlations
Validation of bud development function using temperature correlations
Validation of bud development function for untreated 2002 data
Conclusion • Changes in the FTIR spectra over time have been used to develop a function which appears to track bud dormancy at different sites in two years. • This function shows that the efficacy of HC depends on when and where it is applied. The minimum value for the bud development function appears to signal a good time for HC application.
Recommendations • Knowing the date of budbreak with more certainty should result in increased production levels due to the better timing of:- • management processes such as pruning • the application of dormancy breaking chemicals such as HC • the use of pest and disease chemicals that need to be applied to dormant plants. • Similarly derived FTIR functions could also be used for:- • the rapid testing of new management techniques (e.g. new dormancy regulators) • the modification of standard procedures for new crops and cultivars.
Acknowledgement • The authors would like to thank • Alistair Mowat for initially suggesting the utility of FTIR in this context • Sue Davies, Robert Diack, John Campbell, Laura Haakma and Helen Boldingh for technical assistance. • This work was partially funded through the New Zealand Foundation of Research, Science and Technology Contracts C06X0202 and C06X0706.
References • Richardson AC, Walton EF, Boldingh HL and Meekings JS, Seasonal carbohydrate changes in dormant kiwifruit buds. Acta Hort 753: 567-572 (2007). • Wang SY and Buta JG. Fourier transform infrared spectroscopy of blueberry floral buds in response to chilling temperature exposure. Sixth International Symposium Vaccinium. Eds. D.E. Yarborough and J.M. Smagula, Acta Hort. 446 ISHS 1997. • Tewari JC and Malik K, In situ laboratory analysis of sucrose in sugarcane bagasse using attenuated total reflectance spectroscopy and chemometrics. International Journal of Food Science and Technology, 42: 200-207 (2007). • Cerna M, Barros AS, Nunes A, Rocha SM, Delgadillo I, Copikova J and Coimbra MA, Use of FTIR spectroscopy as a tool for the analysis of polysaccharide food additives. Carbohydrate Polymers, 51: 383-389 (2003). • Hinterstoisser B. Åkerholm M and Salmén, L, Effect of fiber orientation in dynamic FTIR study on native cellulose. Carbohydrate, 334(1): 27-37 (2001). • Wang O, Lu L, Wu X, Li Y and Lin J, Boron influences pollen germination and pollen tube growth in Picea meyeri. Tree Physiology23(5):345-351 (2003).