Download
1 / 52
520 likes | 675 Vues
Chapter 7 delves into the crucial aspects of project planning, encompassing task division into subtasks, duration estimation, resource allocation, and precedence identification. It highlights the benefits of effective project planning like improved communication and resource management. Readers will explore key project planning tools such as Gantt Charts, the Critical Path Method (CPM), and Program Evaluation and Review Technique (PERT). Insights on managing project challenges, understanding critical paths, and the significance of dummy activities enhance comprehension of complex project dynamics.

E N D
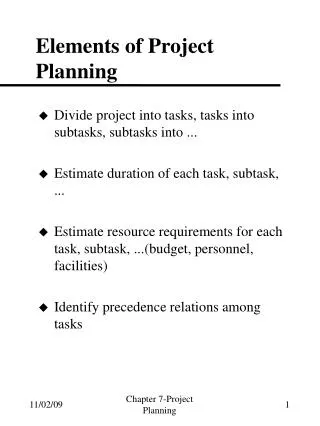
Chapter 7-Project Planning Elements of Project Planning • Divide project into tasks, tasks into subtasks, subtasks into ... • Estimate duration of each task, subtask, ... • Estimate resource requirements for each task, subtask, ...(budget, personnel, facilities) • Identify precedence relations among tasks
Chapter 7-Project Planning Benefits of Project Planning • Communications tool • Resource allocation • Benchmarking
Chapter 7-Project Planning Stages of Engineering Design Projects • Enthusiasm • Disillusionment • Panic • Search for the guilty • Punishment for the innocent • Praise and honors for the non-participants
Chapter 7-Project Planning Project Planning Tools • Gantt Chart • Critical Path Method (CPM) • Program Evaluation and Review Technique (PERT) • Variations and combinations of the above • Many available software packages contain these tools
Chapter 7-Project Planning Gantt Chart for Automobile Bumper Project Fig. 7.2
Chapter 7-Project Planning Enhanced Gantt Chart for Automobile Bumper Project Fig. 7.3
Chapter 7-Project Planning Keeping Track of Project Progress on a Gantt Chart Fig. 7.4
Chapter 7-Project Planning Typical Electric Substation Fig. E7.3.1(a)
Chapter 7-Project Planning Tasks for Designing and Building an Electric Substation Table E 7.3.1
Chapter 7-Project Planning Gantt Chart for Substation Design and Construction Fig. E7.3.1(b)
Chapter 7-Project Planning Critical Path Method (CPM) • Uses a network flow diagram to depict the precedence relations among activities (tasks) • Elements of diagram are directed line segments and nodes • Facilitates identification of activities whose timely completion are “critical” to timely completion of the project
Chapter 7-Project Planning CPM Notation and Conventions • An activity is an ongoing effort on a project task (directed line segment). • Every activity has an initiating event and a closing event (nodes). • Events consume no time. Their primary role in CPM diagrams is to separate activities. • Consecutive activities must be separated by events. Fig. 7.6
Chapter 7-Project Planning CPM Notation and Conventions (cont.) • No pair of events can be directly connected by more than one activity with no intervening events. If an activity R must immediately precede S and T, the relationship is depicted as follows Fig. 7.7(a) • If activities R and S must both immediately precede T, the relationship is depicted as follows Fig. 7.7(b) • All networks must begin with a single Start event and end with a single Finish event.
Chapter 7-Project Planning Dummy Activities • Sometimes precedence relationships require the use of a dummy activity (depicted by a dashed line) to indicate the appropriate relationships. Dummy activities do not take up any time. • Dummy activity is needed to correctly depict that P and Q must precede S, and P must precede R. • Dummy activity needed when several activities have same Start and End events. Activities R and S share the same Start and End events. Fig. 7.10 • Dummy activities should be be included only when needed to display the precedence relation.
Chapter 7-Project Planning Precedence Relations for Several Activities of Bumper Project • Table 7.2
Chapter 7-Project Planning Using Dummy Activity for Bumper Project • Fig. 7.8
Chapter 7-Project Planning Multiple Dummy Activities • A precedes D • A and B precede E • B and C precede F Fig. 7.9
Chapter 7-Project Planning Project Activities and their Precedence Relations • Table 7.1
Chapter 7-Project Planning Constructing a Network Diagram Fig. 7.11 Fig. 7.12
Chapter 7-Project Planning Example of Constructing a Network Diagram • Table E7.4.1 • Fig. E7.4.1
Chapter 7-Project Planning Another Example of Constructing a Network Diagram*
Chapter 7-Project Planning The Critical Path • The critical path is the path of activities from the start event to the finish event for which delay in any activity along that path will delay the project finish. • For projects with a small number of alternative paths, the critical path can be most efficiently identified by finding the longest of the alternative paths.
Chapter 7-Project Planning Alternative Paths and their Length • For the project depicted in Fig. 7.12 Table 7.3 • Thus, A-B-F-G-H-K is the critical path
Chapter 7-Project Planning Critical Path Depicted on Network Diagram Fig. 7.13
Chapter 7-Project Planning Example Problem of Finding the Critical Path*
Chapter 7-Project Planning Alternate Method for Determining Critical Path • This approach is more efficient for larger networks • Use forward sweep to find earliest start (ES) for each activity • Use backward sweep to find latest start (LS) for each activity • Calculate total float (TF) for each activity TF = LS - ES • Critical Path consists of Activities with TF = 0
Chapter 7-Project Planning Earliest Start* • Earliest Start (ES) is the earliest time an activity can start. It is found by tracing forward (from tail to head of each activity arrow) from the project Start event to the tail of the selected activity. When several paths are possible, use the longest path as determined by the sum of the activity durations on that path. • For activity F, ES = 9
Chapter 7-Project Planning Project Duration* • Continue until we have ES for all activities that terminate in the project Finish event. When duration of each of those activities are added to their respective ES times, the largest of the resulting sums is defined as the Project Duration. • For activity H, ES=20 • Project Duration =20+4=24
Chapter 7-Project Planning Latest Start* • Latest Start (LS) is the latest time an activity can start and still have the project completed within the Project Duration time. • LS is found by tracing backwards (from head to tail of each activity) from the project Finish event to the tail of selected activity. Make sure you reach the tail of the selected activity via the head of that activity. When several paths are possible, use the longest path as determined by the sum of the activity durations on that path. The Project Duration minus the length of this longest path is the LS for the selected activity. • For activity A, LS=24-24=0
Chapter 7-Project Planning Total Float • Total Float for each activity is the difference between the latest start and the earliest start. TF = LS - ES • The activities for which TF=0 define the critical path.
Chapter 7-Project Planning Summary of Total Float Calculations* • Critical Path consists of A-D-F-G-H
Chapter 7-Project Planning Total Float Calculations • Table 7.4 • For project shown in Fig. 7.12
Chapter 7-Project Planning Example of Critical Path Determination • Fig. E7.4.2(a)
Chapter 7-Project Planning Summary of Example Float Calculations • Table E7.4.2
Chapter 7-Project Planning Critical Path for Example Problem • Fig. E7.4.2(b)
Chapter 7-Project Planning Program Evaluation and Review Technique (PERT) • Based on Critical Path Method • Replaces single estimate of activity duration by a probability distribution • Allows estimate of probability of completing project by a specified time
Chapter 7-Project Planning Typical Beta Distributions for Activity Durations • to-optimistic estimate; the shortest time within which this activity can be completed assuming everything goes right. This is the left terminus of the pdf. • tm-the most likely time required to complete the activity. This is the mode of the pdf. • tp- pessimistic estimate; the longest time it will take this activity to be completed assuming everything goes wrong. This is the right terminus of the pdf. Fig. 7.14
Chapter 7-Project Planning Network Diagram for PERT Example Problem Fig. 7.15
Chapter 7-Project Planning PERT Procedure • Calculate the expected duration te (mean) of each activity • Calculate the variance 2of each activity • Use te to determine the expected project duration Te and identify the critical path
Chapter 7-Project Planning Determination of Critical Path for PERT Example Calculation • Table 7.5
Chapter 7-Project Planning PERT Critical Path Fig. 7.16
Chapter 7-Project Planning Probability of Completing Project by Specified time Ts • Calculate the variance of the project duration as the sum of the variances of the activities on the critical path • Use the standard normal variable z to find the probability of completing the project in a specified time Ts • For Ts=20 • From Table 5.1 Pr (z < -0.57) = 0.285
Chapter 7-Project Planning Space Station PERT Problem • Fig. E7.5.1(a) This image is not yet available
Chapter 7-Project Planning Activities for Space Station PERT Problem • Table E7.5.1(a)
Chapter 7-Project Planning PERT Diagram for Space Station Project • Fig. E7.5.1(b)
Chapter 7-Project Planning Summary of PERT Calculations for Space Station Project • Table E7.5.1(b)
Chapter 7-Project Planning Another PERT Example Problem*
Chapter 7-Project Planning Probability of Completing Project by Specified time Ts* • Calculate the variance of the project duration as the sum of the variances of the activities on the critical path • Use the standard normal variable z to find the probability of completing the project in a specified time Ts • For Ts=30 • From Table 5.1 Pr (z < 1.48) = 1 - Pr (z < -1.48) = 1 - 0.067 = 0.932
Chapter 7-Project Planning CPM Diagram with Nodes Numbered Fig. 7.17
Chapter 7-Project Planning Calendarized Version of Network Diagram Fig. 7.18