Download
1 / 62
630 likes | 655 Vues
Discover how class assignment in grades K-3 influences adult outcomes, based on the Project STAR experiment by Harvard researchers. Explore correlations between kindergarten test scores and various adult achievements using U.S. tax data.

E N D
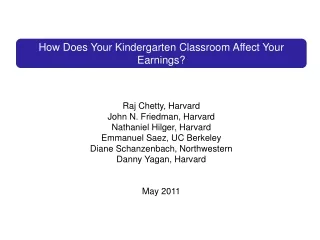
How Does Your Kindergarten Classroom Affect Your Earnings? Evidence from Project STAR Raj Chetty, Harvard John N. Friedman, Harvard Nathaniel Hilger, Harvard Emmanuel Saez, UC Berkeley Diane Schanzenbach, Northwestern Danny Yagan, Harvard May 2011
Introduction • What are the long-term impacts of early childhood education? • Limited evidence because few datasets link information on childhood education with adult outcomes • We link data from the STAR experiment to U.S. tax records to analyze how class assignment in grades K-3 affects adult outcomes
Project STAR Background • Student/Teacher Achievement Ratio (STAR) experiment: • Conducted from 1985 to 1989 in Tennessee • One cohort of 11,571 children in grades K-3 at 79 schools • Most children born in 1979-80 graduate high school in 1998 • Students and teachers randomized into classrooms within schools • Class size differs: small (15 students) or large (22 students) • Classes also differ in teachers and peers • Randomized into classroom upon entry into participating school and kept in small/large track from grades K-3 • Only one cohort treated no repeat teacher observations
Project STAR Background • Large literature on STAR shows that class size, teacher quality, and peer quality have causal impacts on scores • Students in small classes have 5 percentile point (0.2 sd) higher test scores in K-3 (Krueger 1999) • But test score gains fade out to 1-2 percentiles by grade 8 • Similar fade out effects observed in other early childhood interventions (e.g. Currie and Thomas 1995, Deming 2009) • Do early test score gains translate into impacts on adult outcomes?
United States Tax Data • Dataset covers full U.S. population from 1996-2008 • Approximately 90% of working age adults file tax returns • Third-party reports yield data on many outcomes even for non-filers • Employer and wage earnings from W-2 forms • College attendance from 1098-T forms • 95% of STAR records were linked to tax data
Outline • Test scores and adult outcomes in the cross-section • Impacts of observable classroom characteristics • Impacts of unobservable classroom characteristics • Fade-out, re-emergence, and non-cognitive skills • Cost-benefit analysis
Part 1: Cross-Sectional Correlations • Begin by correlating KG test scores with adult outcomes • Useful to benchmark estimates from randomized interventions • Estimate both raw correlations and OLS regressions with controls: • - quartic in parental household income interacted with marital status • - mother age at child’s birth • - parent’s 401K contributions, home ownership • - child’s gender, free lunch status, race, and age • Test score: percentile score on Kindergarten Stanford Achievement Test (math + reading)
What is a kindergarten test? • Instructions: • I’ll say a word to you. Listen for the ending sound. • You circle the picture that starts with the same sound. “cup”
Figure 1a: Wage Earnings vs. KG Test Score $25K $20K Mean Wage Earnings from Age 25-27 $15K R² = 0.05 $10K 0 20 40 60 80 100 KG Test Score Percentile
Figure 1b: College Attendance Rates vs. KG Test Score 80% 60% Attended College before Age 27 40% 20% 0% 0 20 40 60 80 100 KG Test Score Percentile
An Earnings-Based Index of College Quality • We construct an index of college quality using tax data • Tuition paid to any higher ed. institution (Title IV) automatically generates a 1098-T form linking student and institution • Calculate average wage earnings (from W-2s) by college • For those who do not attend college, define college quality index as mean earnings for those not in college in 1999
College Quality vs. KG Test Score $28K $26K $24K Earnings-Based College Quality Index $22K $20K $18K 0 20 40 60 80 100 KG Test Score Percentile
Home Ownership vs. KG Test Score 40% Owned a Home by Age 27 30% 20% 0 20 40 60 80 100 KG Test Score Percentile
Retirement Savings vs. KG Test Score 45% 40% 35% Made a 401(k) Contribution by Age 27 30% 25% 20% 0 20 40 60 80 100 KG Test Score Percentile
Marriage by Age 27 vs. KG Test Score 55% 50% 45% Married by Age 27 40% 35% 30% 25% 0 20 40 60 80 100 KG Test Score Percentile
Cross-State Mobility vs. KG Test Score 35% 30% Lived Outside TN before Age 27 25% 20% 0 20 40 60 80 100 KG Test Score Percentile
Percent College Graduates in ZIP code vs. KG Test Score 22% 20% 18% Percent College Graduates in 2008 ZIP 16% 14% 0 20 40 60 80 100 KG Test Score Percentile
Part 2: Validity of the STAR Experimental Design • Validity of experimental analysis rests on two assumptions: • Assumption 1: Randomization • All pre-determined variables (e.g. parent characteristics) are balanced across classrooms • Assumption 2: No Differential Attrition • 95% match rate little attrition here • No evidence of differences in match rates across classrooms • No evidence of differences in death rates across classrooms
Part 3: Class Size Impacts • Regress outcomes on dummy for small class assignment (intent to treat) with school fixed effects • Analyze impacts on four outcomes: • 1. College attendance • 2. College quality index • 3. Mean earnings (ages 25-27) • 4. Standardized (SD = 1) summary index of other outcomes: • Index = 401K + Home Owner + Married + Moved out of TN + Pct. College Grads. in Zip
Figure 2a: Effect of Class Size on College Attendance by Year 30% 25% Percent Attending College 20% 15% 10% 2000 2002 2004 2006 Year Large Class Small Class
Figure 2b: College Earnings Quality by Class Size Frequency $20K $30K $40K $50K Earnings-Based Index of College Quality Large Class Small Class
Figure 2c: Effect of Class Size on Wage Earnings by Year $18K $16K $14K $12K Wage Earnings $10K $8K $6K 2000 2002 2004 2006 Year Large Class Small Class
Table 5: Impacts of Class Size on Adult Outcomes Note: All specifications control for school-by-entry-grade effects.
Part 3: Teacher/Peer Effects • Students randomly assigned to classes that differ in teacher and peer quality • Do teachers/peers affect adult outcomes? • First test: does random assignment to a more experienced KG teacher improve adult outcomes? • Not necessarily causal effect of raising teacher experience per se • Experienced teachers may also differ on other dimensions such as dedication to teaching
Figure 3a: Effect of Teacher Experience on Test Scores 56 54 52 KG Test Score Percentile 50 48 0 5 10 15 20 Kindergarten Teacher Experience (Years)
Figure 3b: Effect of Teacher Experience on Earnings $19K $18K Mean Wage Earnings, 2005-2007 $17K $16K 0 5 10 15 20 Kindergarten Teacher Experience (Years)
Figure 3c: Effect of Teacher Experience on Earnings by Year $20K $1104 $18K $16K $14K Wage Earnings $12K $10K $8K 2000 2002 2004 2006 Year Teacher Experience <=10 Years Teacher Experience > 10 Years
Table 6: Observable Teacher vs. Peer Effects Note: All specifications control for school fixed effects and class size, as well as student and parent demographics.
Part 4: Unobservable Class Effects • Many elements of teacher and peer quality (e.g. clarity of instruction, enthusiasm) are not observable • Well known problem in literature on teacher effects • Test for “class effects” on adult outcomes using analysis of variance • Is there significant intra-class correlation in student’s outcomes? • This class effect includes effect of teachers, peers, and any class-level shocks such as noise outside classroom • Formally, we are testing for clustering of outcomes by (randomly assigned) classroom
A Model of Class Effects • Test scores and earnings for individual iin class c: • zc = class-level intervention (e.g. better teaching) that affects scores and earnings • zYc = intervention that affects earnings but not scores
A Model of Class Effects • Test scores and earnings for individual iin class c: • zc = class-level intervention (e.g. better teaching) that affects scores and earnings • zYc = intervention that affects earnings but not scores • aic = academic ability • nic = earnings ability orthogonal to academic ability
A Model of Class Effects • Test scores and earnings for individual iin class c: • zc = class-level intervention (e.g. better teaching) that affects scores and earnings • zYc = intervention that affects earnings but not scores • aic = academic ability • nic = earnings ability orthogonal to academic ability • b + g = impacts of interventions on earnings • b = covariance of class effects on scores and earnings
A Model of Class Effects • Test scores and earnings for individual iin class c: • Thus far, we have estimated b directly by using observable z’s that affect test scores (e.g. teacher experience) • How can we estimate b and g when class-level interventions are unobserved?
Strategy 1: Analysis of Variance • Test for class effects on earnings (b + g > 0) using ANOVA • Do earnings vary across classes by more than what would be predicted by random variation in student abilities? • Two steps: • [Fixed effects] Test for significance of class fixed effects • [Random effects] Estimate class-level SD of outcomes assuming normally distributed class effects
Table 7: Analysis of Variance: Kindergarten Class Effects Note: All specifications control for school fixed effects and class size.
Strategy 2: Covariance of Class Effects on Scores and Earnings • ANOVA does not tell us whether class effects on scores are correlated with class effects on earnings (b > 0) • Do class-level interventions that raise test scores also improve adult outcomes? • Turn to a second strategy to measure covariance between class effects on scores and earnings (b ) • What is the correlation of class effects on scores and class effects on earnings? • Derive estimator for b and prove it is unbiased in paper; give a heuristic explanation here
Peer-Score Measure of Class Quality • Average end-of-year test scores in class relative to school sc is a (noisy) measure of class effect on scores: • Motivates regression of the form: • Own-observation bias: with finite class size, EbM> 0 even if bM = 0 • Smart kid raises average class score and has high earnings • Analogous to bias in 2SLS estimate with weak instruments • Use jackknife (leave-out mean) to measure class effect on scores: sc-i
Peer-Score Measure of Class Quality • Regression specification: • This regression does not estimate peer effects because we are using end-of-year test scores • Class quality sc-i captures teacher quality + class-level shocks • Good teachers raise peers’ end of year scores • Class quality sc-i varies randomly within schools • Can test whether classes that generate test score gains also generate earnings gains
Peer-Score Measure of Class Quality • Regression specification: • Three remaining sources of bias in bLM • 1. Mechanical: Peers below-avg. you are above avg. (Guryan, Kroft, • Notowidigdo 2009). Solution: define intercept using leave-out mean • 2. Attenuation: sc-iis a noisy measure of class quality • 3. Reflection: with peer effects, smart kid raises peers’ scores and earns a • lot, driving up bLM • After presenting results, we bound reflection bias and show it is smaller than attenuation bias
Figure 4a: Effect of Early Childhood Class Quality on Own Score 70 65 60 55 Own Test Score Percentile 50 45 40 -20 -10 0 10 20 Class Quality (End-of-Year Peer Scores)
Figure 4c: Effect of Early Childhood Class Quality on Earnings $17.0K $16.5K $16.0K Mean WageEarnings, 2005-2007 $15.5K $15.0K $14.5K -20 -10 0 10 20 Class Quality (End-of-Year Peer Scores)
Figure 5a: Effect of Class Quality on Earnings by Year $18K $875 $16K $14K Wage Earnings $12K $10K $8K 2000 2002 2004 2006 Year Above-Average Class Quality Below-Average Class Quality
Table 8a: Impacts of Class Quality on Earnings NOTE--All regressions control for student and parent demographics and school-by-entry-grade fixed effects.
Bounding Reflection Bias • Small impact of KG class quality on subsequent test scores places a tight upper bound on reflection bias • Smart kids score high on all tests (test scores highly autocorrelated) • To have large reflection bias, smart kid must raise peer scores a lot • Large correlation between peer scores and own score in later grades • We formalize this intuition in a linear-in-means model and derive a bound on the degree of reflection bias • Observed correlation between KG peer scores and 8th grade score places an upper bound on reflection bias of 20% • Variance in scores implies attenuation bias of 20% as well
Figure 6a: Fadeout of Class Effects Effect of 1 SD of Class Quality on Test Scores by Grade 10 8 6 Test Score Percentile 4 2 0 E 0 2 4 6 8 Grade 1 SD Class Quality Effect on Test Scores 95% CI
Figure 6b: Fadeout of Class Effects Effect of 1 SD of Class Quality on Earnings $1000 $800 $600 Wage Earnings $400 $200 $0 E 0 2 4 6 8 Grade 1 SD Class Quality Effect on Wage Earnings 95% CI