CALET Simulation
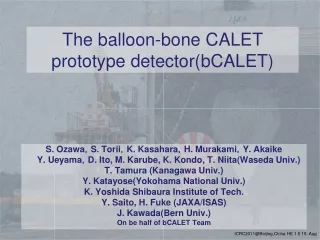
CALET Simulation. 17, May. 2011 Yosui Akaike Waseda University. ~Simulation & Modeling Meeting in INFN Pisa~. Outline. Detector Configuration Trigger Condition Detection Efficiency Geometrical Factor Energy Resolution Particle Identification electrons/protons separation

CALET Simulation
E N D
Presentation Transcript
CALET Simulation 17, May. 2011 Yosui Akaike Waseda University ~Simulation & Modeling Meeting in INFN Pisa~
Outline • Detector Configuration • Trigger Condition • Detection Efficiency • Geometrical Factor • Energy Resolution • Particle Identification • electrons/protons separation • charge resolutionof CHD and SciFi • Trigger Rate on ISS orbit
Baseline Configuration • The current detector model in our simulation is composed of active parts and major absorber parts of the calorimeter • This model consists of; • 28 plastic scintillator paddles - 3.2 x 44.8 x 1.0 cm3 • 7168 SciFi ‘s 0.1 x 44.8 x 0.1 cm3 • Tungsten plates 44.8 x 44.8 x 0.07 cm3 x 3 38.4 x 38.4 x 0.07 cm3 x 2 32.0 x 32.0 x 0.35 cm3 x 2 • 192 PWO logs 2.0 x 2.0 x 32.0 cm3 • no PMT, APD/PD, frames, cables, etc… • No gaps between scintillators in • CHD, IMC and TASC • Tentative size of spaces are assigned between : • CHD-IMC • IMC-TASC CHD IMC TASC (Some results in this presentation are made by different version models which have SIA in substitution for CHD)
Shower Images Gamma-ray 10GeV Electron 1TeV p 10TeV
Trigger system • Trigger sources • Sum of each 2 SciFi layers: 4 x 2 (X,Y) signals • Sum of the top layer of TASC • CHD • Trigger mode • High energy shower (all particles > 10 GeV) • Low energy shower (electrons > 1 GeV) • Single (for calibration) (all particles) In order to eliminate background events of low energy protons, trigger condition should be set to obtain only particles initiating the cascade shower. CALET is equipped with several trigger sources and three trigger modes IMC1+2 IMC3+4 IMC5+6 IMC7+8 TASC1 Trigger condition such as threshold for each trigger source should be optimized with simulation studies.
High Energy Shower Trigger The distribution of MIPs at the top TASC layer • Target • e > 10GeV • γ > 10GeV • p, nuclei > a several 10GeV 95% • Trigger Condition ① TASC1 > 55MIP ② IMC7+8> 15MIP p30GeV:15% p10GeV:3.7% The threshold of TASC1 is determined to detect 95% of the 10GeV electrons. The threshold of IMC7+8 is determined to detect 98% of 10GeV gamma-rays, of which converted above IMC7. (Least 2 points (IMC7 and IMC8) are needed to reconstruct a tracking in IMC) Non-showered events of proton and nuclei are rejected by these threshold. IMC1+2, IMC3+4, IMC5+6 will be not used to; ①detect not only electrons but also gamma-rays. ②detect events incoming from the detector side. The distribution of MIPs at IMC7+8, events which converted below IMC8 are ignored γ : 10GeV 15MIP 98%
Detection Efficiency First conversion points of gamma-rays The detection efficiency of high energy shower trigger: (electrons) 95%:10GeV, 99% >20GeV (gamma-rays) ~ 80% > 10GeV The ratio of the first conversion of gamma-rays above W6 is ~80%. W6 W1 W2 W7 PWO Detection efficiency of electrons Detection efficiency of gamma-rays ―all triggered ―conversion points > W6
Low Energy Shower Trigger • Target • e > 1GeV • Trigger Condition ① IMC1+2 > 0.7 x 2(layers) MIP ② IMC3+4 > 0.7 x 2 MIP ③ IMC5+6 > 0.7 x 2 MIP ④ IMC7+8 > 5 MIP ⑤ TASC1 > 7MIP (eff.95 of 1GeV electrons) Detection efficiency of electrons The thresholds of IMC1+2, IMC3+4, IMC5+6 are determined to detect a single track. The thresholds of IMC7+8, TASC1 are determined to detect 95% of the 1GeV electrons - the target is only electrons - the flux in this energy region is very high, ⇒ IMC1+2, IMC3+4, IMC5+6 will be also used to detect only full-contained events.
Geometrical Factor Electrons : number of generated events : number of triggered events : incident area : solid angle () Classification by the shower axis geometry ② ① Gamma-rays ③ ④ >
Deposit Energy Gamma 100GeV ―TASC ―TASC+IMC The incident energy of electrons and gamma-rays was estimated by the total deposit energy of IMC & TASC. Electron 10 GeV ―TASC ―TASC+IMC Electron 1TeV ―TASC ―TASC+IMC
Energy Resolution ○:TASC (②③④) □:TASC (①) ●:TASC+IMC (②③④) ■:TASC+IMC (①) ①: full-contained events ②~④: partially contained events
Electrons / Protons identification Requirement of proton rejection power e : p = 1 : 100 @10GeV ⇒ rejection power : ~104 e : p = 1 : 1000 @1TeV ⇒ rejection power : ~105 Estimation of the proton rejection power at TeV region 95%eff. Electrons : 1TeV Protons : 1~1000TeV (E-2.7dE) (Number of protons) (generated) 1.6 x 10⁶ ↓ (triggered) ~52000 ↓ (energy bin) ~8700 ―e ―p
Electrons / Protons identification Scatter plots for electrons and protons. Classification by the shower axis geometry ② ① (=FE) ③ ④ (=RE) > 95% efficiency of electrons, 4 protons are contained. ⇒ Proton rejection power : ~2.0 x 10⁵ (90%C.L.) : shower axis center : ΔE at i-th layer, j-th PWO
Detection efficiency of nuclei High energy shower trigger ・IMC7+8 > 15MIP ・TASC1 > 55MIP Detection Efficiency ② ② ① ① these increase is influence of the backscattering of the events of which the interaction occur in the lower layer of TASC. ② In case of high z particles, non-showered events can be detected because of large dE/dx (Fe) ~100% efficiency (N) in low energy region (<10GeV); N 5GeV
Deposit Energy of Nuclei Incident energy of nuclei was measured by of TASC. 100GeV/A 10TeV/A Fe 10TeV/A case of Fe The distribution of of heavy nuclei such as Fe depends on the target nucleus. The number of secondary in case of heavy target is larger than the one of light target. (Interaction model : DPMJET3)
Energy resolution of nuclei If we select events of which interaction occur above the top layer of TASC, (Interaction model : DPMJET3) r.m.s. / <ΔE>
Charge resolution The charge resolution of CHD and SciFi was estimated with; - back-scattering - quenching The Np.e.was calculated from the ΔE, assuming the following typical values; • CHD : Nphoton/MeV = 10000, Npe/MIP = 100 • SciFi : Nphoton/MeV = 10000, Npe/MIP = 10 CHD SciFi ---p (ΔE) ― p (NP.E.) --- He (ΔE) ― He (NP.E.) ---p (ΔE) ― p (NP.E.) --- He (ΔE) ― He (NP.E.)
Charge resolution The number of the incident particles to detector was estimated as SΩ~ 0.07m2sr. Events which the first collision occur at the top layer of TASC was selected. CHD : 1TeV/A (1year) ―p ―He ―B ―C SciFi : 100TeV/A (5years) ―p ―He ―C CHD : 10TeV/A (5year)
Estimation of the trigger rate on ISS orbit The trigger rate on ISS is evaluated by estimation of cosmic ray flux including primary particles and albedo particles. • 1. Estimated Flux on ISS Orbit (at an altitude of 400km) • primary cosmic rays are assumed by some satellite and balloon experiments • particle transportation in geomagnetism ・・・・・・ Cosmos, ATMNC3 • (ATMNC3: Atmospheric Muon Neutrino Calculation code 3-dimensional version) Model of geomagnetism --- IGRF2005 Model of atmosphere -----– US-standard1976 (high energy shower trigger) primary: Cosmos, albedo: ATMNC3 (low energy shower trigger ) primary: ATMNC3, albedo: ATMNC3 Output : particle kind, energy, zenith angle • 2. Trigger rate with detection efficiency • detector response : EPICS
Trigger Rate on ISS orbit The density map of trigger rate (High Energy Shower Trigger) Energy Spectra (High Energy Shower Trigger) Latitude[deg.] Longitude[deg.] (Low Energy Shower Trigger) Average of trigger rate • (High) Ave. of orbit :11.4Hz e-:0.78, p:5.5, He:2.7, C:0.47, Fe:0.11, the other:1.84 • (Low) Ave. of 5 min. in highest latitude:108Hz e-:8.3, p:74.8, the other:24.9
Prototype Detector for SPS beam test layer layer (2-6) (7,8) x for Shower trigger r.l. : (same as CALET) Only longitudinal direction layer st for Shower trigger nd ~ r.l. : (2/3 of CALET) Only longitudinal direction
Example for events Simulation electron electron posictron • Event viewer • particle density disclibed byColors • the number is number of MIP Number of MIP Exp. Data electron
Energy Deposit in IMC Vertical: event count Horizontal:Energy Deposit [MIP] (Horizontal axis is Log scale) Each Layer • Positron 10GeV ・Energy deposit in sum of each layer It could find the first interaction point by layer 1~6 ・Sum of energy deposit in IMC Layer 1 Layer 2 Single event Shower event Simulations & Exp. Data are consistent Layer 3 Layer 4 Mean difference: 0.848% Layer 5 Mean difference: 1.17% All SciFi Layer 6 Layer 7 Layer 8 Data : 215 ~70 MIP 24
Energy Deposit in TASC Vertical: event count Horizontal:Energy Deposit [MIP] (Horizontal axis is Log scale) Each Layer • Positron 10GeV ・Energy deposit in sum of each layer Using data → Layer1:PMT, Layer2~8:APD Consistent in each TASC layer (PMT-MIP is calibrated with this data) ・Sum of energy deposit in TASC (without Layer 7) Layer 1 Layer 2 ~110 MIP Layer 3 Simulations & Exp. Data are consistent Layer 4 Mean difference: 0.163% Layer 5 Mean defference: 0.461% All PWO Layer 6 Layer 7 Layer 8 Data : 215 25
Energy Deposit in IMC Vertical: event count Horizontal:Energy Deposit [MIP] (Horizontal axis is Log scale) Each Layer • Positron 150GeV ・Energy deposit in sum of each layer we can find the first interaction point by layer 1~5 ・Sum of energy deposit in IMC Layer 1 Layer 2 Simulations & Exp. Data are consistent Shower event Single event Layer 3 (Mean value of Geant4 results has a tendency to be lower) Layer 4 Mean diff: 1.70% Layer 5 Mean diff: 6.88% All SciFi Layer 6 Layer 7 Layer 8 Data : 261&449 ~280 MIP 26
Energy Deposit in TASC Vertical: event count Horizontal:Energy Deposit [MIP] (Horizontal axis is Log scale) Each Layer • Positron 150GeV ・Energy deposit in sum of each layer Using data → Layer1:PMT, Layer2~8:APD Consistent in each TASC layer ・Sum of energy deposit in TASC (without Layer 7) Layer 1 Layer 2 Layer 3 There’s a difference of distribution (Difference of mean value : ~ 1%) ~1400 MIP Layer 4 Mean diff: 0.983% Layer 5 Mean diff: 1.14% All PWO (without layer7) Layer 6 APD disabled Layer 7 Layer 8 Data : 449 27
Energy Resolution Energy Resolution in TASC Define “Energy Resolution”, using histogram of energy deposit in TASC Energy Resolution : RMSTASC / < ETASC > ・ Simulation data have the same tendency as Exp. data In high energy region, resolution degradation by shower leakage effects. ・ Resolution of Exp. data is lower → contaminant particles → multi-hit events color : Exp. & Geant4 & EPICS Vertical axis : Energy Resolution in TASC Horizontal axis : Energy of incident particles preliminary Shower leakage effects 28
Lateral Spread Lateral shower spread of IMC, TASC (Positron 10GeV) ・For energy weighted spread of IMC, Using events of 1mm inner side of IMC layer 8. ・In IMC, simulation and exp. data have a similar distribution. (Difference of mean value : ~4%) ・In TASC, simulation and exp. data have a similar distribution. (1cm edge : only 2 PWO logs in each layer) IMC [ Formula of Energy Weighted Spread RE ] Ex. TASC TASC Data : 451 29
Lateral Spread Lateral shower spread of IMC, TASC (Positron 150GeV) ・For energy weighted spread of IMC, Using events of 1mm inner side of IMC layer 8. ・In IMC, simulation and exp. data have a similar distribution. (Difference of mean value : ~3%) ・In TASC, there is a little difference in distribution. (Diffirence of mean value : ~2%) IMC [ Formula of Energy Weighted Spread RE ] TASC Ex. TASC Data : 449 30
Angular resolution (electron) Distribution of the incoming direction deciding from reconstructed shower analysis Shower core IMC 1st layer Anguler distribution(electron10GeV) black:Simulationred:exp data Example event (electron 10GeV) IMC8th layer Energy dependency of angular resolution
e/p separation by IMC data Distribution of shower spread (e10GeV and hadron 30GeV) Weighted spread of shower particles Deposit energy in ith SciFi Deposit energy in jth SciFi Core position of reconstructed shower electron Hadron