Increasing Response Rates featuring Qualtrics
230 likes | 254 Vues
Learn valuable insights on increasing response rates during the session featuring Qualtrics specialists Jenna Klink and Kadi Row. Join us on September 30, 2019, via Zoom for an informative discussion and optional Q&A. Discover why response rates matter, what qualifies as good response rates, and practical tips to motivate participation and build trust. Understand the foundational principles of survey design and uncover strategies to reduce costs, increase benefits, and engender trust with respondents. Enhance your survey design skills and optimize response rates with expert advice and practical techniques.

Increasing Response Rates featuring Qualtrics
E N D
Presentation Transcript
Increasing Response Ratesfeaturing Qualtrics Jenna Klink, Evaluation & Program Development Specialist Kadi Row, Evaluation & Program Development Specialist September 30, 2019 via Zoom
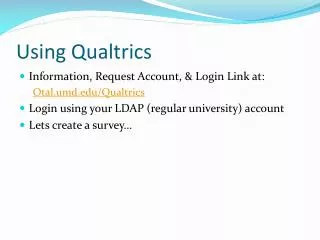
Intro • 11:00-11:30: Content • 11:30-12:00: Optional discussion, Q&A Survey.wisc.eduwhich takes you to https://it.wisc.edu/services/surveys-qualtrics/
https://cdn.shopify.com/s/files/1/0145/8808/4272/files/N4102.pdfhttps://cdn.shopify.com/s/files/1/0145/8808/4272/files/N4102.pdf
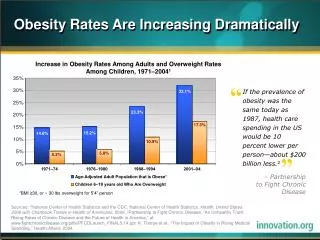
Why do we care about response rates? • The more people, the more potential varying perspectives we can capture to understand our programming • The people who don’t respond right away or typically may have something extremely important, or potentially transformative, to say! iStock/VictoriaBar @diverseperspectivesfacebook page
What are “good” response rates? • Everyone’s FAVORITE answer: it depends! • From Amulya Rao, Evaluation/Project Specialist @ Natural Resources Institute: • Surveys done in-person at the end of an event will give you the highest response rate...close to 100% • For online surveys with a moderate sample size, anything above 50% is good • Mailed surveys – it depends, they can have a lower or higher response rates than online based on the additional hurdle of mailing the survey back & whether someone is a frequent email user – generally a 35% response rate is acceptable
Whiteboard or Chat Box: Describe a time you were not motivated to start or complete a survey
Dillman-Survey Researcher • The likelihood of obtaining questionnaire answers is greatest if the survey designer simultaneously focused on: • reducing costs, • increasing benefits, and • engendering trust that the expected benefits of responding would outweigh the costs of responding • Reference: https://sesrc.wsu.edu/about/total-design-method/
Reducing costs • What are the costs of taking a survey? • Time • Simplify your instrument • Screenshare: Generate dummy data in Qualtrics • Mental energy/frustration • Pilot test • Screenshare: Use preview link to send to pilot testers • Standard questions for pilot testers: • how long did it take? • was anything confusing or frustrating? • Make sure they know they may be asked to take survey again if there are changes made • Fear-how will data be used? • Be clear if responses are confidential (identifying info is kept safe) or anonymous (no identifying info is collected)
Increasing benefits • What are the benefits of taking a survey? • Knowing you’re contributing to something important, e.g. knowledge generation or improvement of a program • If potential respondents follow the norm of social responsibility, then they are likely to comply with a request if it is presented in terms of asking for help. You leverage respondents’ desire to view themselves as helpful and generous people. • You might say “your participation would really help us out.” • The more relevant the topic seems, the more likely a respondent is to participate. • you might point out that the recipient has been contacted because of his or her past action (such as attending a workshop); • that his or her participation has implications for a system or process (“Your suggestions will help us to improve our service”); • or that the respondent will benefit tangibly (“Your feedback will determine how we structure your division”). Reference: Ritter & Sue, 2007. New Directions for Evaluation, Special Issue: Using Online Surveys in Evaluation, no. 115
Increasing benefits • Having your voice heard • A chance to give feedback • Receiving an incentive • Research varies on this. If you can offer one and if it’s anonymous survey, you can include a link to a google form at the end where they can enter their contact info. • Two studies found that the type of lotteries with a higher chance of winning & smaller prize are most effective (Deuskens et al 2004, Misra et al 2012) • Incentives increase RR only modestly. Advance or prepaid incentives tend to be more effective. Limited success of money and gift certificates. Lotteries do not increase response rates significantly. If you do use a lottery, you might improve success by informing the respondents that they will receive the results of the lottery immediately upon completing the survey. An electronic incentive sent to all sample members with the survey request is likely the best option. (Dillman 2014, also confirmed by research UW-Extension conducted) • Purdue social scientist (Linda Prokopy) who does lots of long surveys to ag communities says small cash amount to everyone (vs lottery) is best with mailed surveys. • Note, it can be hard to get incentives approved with university dollars
Engendering trust • Be transparent with respondents about the purpose of survey, use of results
Survey design considerations • Beyond piloting and being very clear about why you’re collecting data and how you’ll use it (in order to be as succinct as possible)… • Add in page breaks so that at least some data saves for people who stop taking survey part way through • After last survey question, add a final ‘question’ that’s just text that says "Please click next one last time to be sure your response is recorded. Thank you for completing the survey!” • Give the respondents an idea of how long the survey is through question numbering (Question 1 of 10, Question 2 of 10) or show a progress bar (but check to see if progress bar seems accurate)
Miscellaneous • Calculating an accurate response rate • Make sure to deactivate survey so that partially recorded responses are recorded (Qualtrics’ default is to record them after 1 week, can change in Survey Options): • Don’t just trust the number of responses that Qualtrics displays in the web browser under Data & Analysis, download data and delete out or disregard those who clicked/opened the survey but didn’t fill out anything substantial
Survey distribution considerations • Send out 3-4 total times! Watch response rate go up each time! • Set up respondents/distribution as a “Contact list” via Qualtrics rather than sending same link to everyone via regular email • Tracks respondents/non-respondents, on reminders you know you’re only asking non-respondents • Can personalize by piping in name and making it clear that it would be useful to hear from them • Embed a survey Q in email
Survey distribution considerations • Be conscious of: • Who is sending the emails • When you send the emails • Not on Mondays or Fridays • Not before work day begins • Once a week, or when responses start to taper • What the emails say including subject line • Can try social norming as an approach…X number of your peers have taken the survey but hearing from you too will help us XYZ • Approach: switch it up, you have 3-4 total sends to do so!
Upcoming Zooms! • Participation Records – October 14, 11-12 • Christian Schmieder • Needs Assessments – November 4, 11-12 • Kadi Row, Jenna Klink • Plans of Work – December 9, 11-12 • Josset Gauley
Whiteboard/Chat box: What ideas do you have to increase benefit, decrease cost, and engender trust?