Molecular basis of evolution.
230 likes | 374 Vues
Explore the molecular basis and mechanisms of evolution, from analyzing DNA sequences to studying gene duplication and recombination. Learn about the evolution of mankind and the genetic changes that drive species diversification. Discover how mutations, codon usage, and substitution patterns shape evolutionary distances. Study the fixation of mutations and the estimation of evolutionary rates using advanced techniques like P-distance and Dayhoff matrices. Dive into the fascinating world of molecular phylogenetics and the construction of evolutionary trees based on genetic data.

Molecular basis of evolution.
E N D
Presentation Transcript
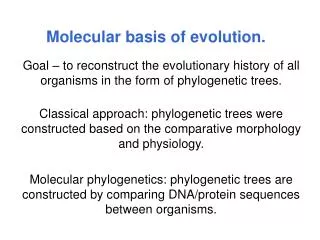
Molecular basis of evolution. Goal – to reconstruct the evolutionary history of all organisms in the form of phylogenetic trees. Classical approach: phylogenetic trees were constructed based on the comparative morphology and physiology. Molecular phylogenetics: phylogenetic trees are constructed by comparing DNA/protein sequences between organisms.
Evolution of mankind. Analysis of mitochondrial DNA proposes that Homosapiens evolved from one group of Homo erectus in Africa (African Eve) 100,000 – 200,000 years ago. American indians I, 25-35,000 Europeans 40-50,000 American indians II, 7-9,000 Asians 55-75,000 Africans 100,000 Adam appeared 250,000 years ago, much earlier!
Mechanisms of evolution. • Evolution is caused by mutations of genes. • Mutations spread through the population via genetic drift and/or natural selection. • If mutant gene produces an advantage (new morphological character), this feature will be inherited by all descendant species.
Mutational changes of DNA sequences. 1. Substitution.3. Insertion. Thr Tyr Leu Leu Thr Tyr Leu Leu ACC TAT TTG CTG ACC TAT TTG CTG ACC TCT TTG CTG ACC TAC TTT GCT G— Thr Tyr Leu Leu Thr Tyr Phe Ala 2. Deletion. 4. Inversion. Thr Tyr Leu Leu Thr Tyr Leu Leu ACC TAT TTG CTG ACC TAT TTG CTG ACC TAT TGC TG- ACC TTT ATG CTG Thr Tyr Cys Thr Phe Met Leu
Gene duplication and recombination. New genes/proteins occur through the gene duplication and recombination. Gene 1 Ancestral globin + duplication Gene 2 globin globin hemoglobin myoglobin New gene Duplication Recombination
Codon usage. Phe UUU Ser UCU Tyr UAU UUC UCC UAC Leu UUA UCA Cys UGU UUG UCG UGC Frequencies of different codons for the same amino acid are different. Codon usage bias is caused: • Translationary machinery tends to use abundant tRNA (and codons corresponding to these tRNA). Codon usage bias is the same for all highly expressed genes in the same organism. • Mutation pressure. Difference between mutation rates between GC AT and AT GC. GC-content is different in different organisms.
Synonymous and nonsynonymous nucleotide substitutions. Synonymous substitutions in codons do not change the encoding amino acid, occur in the first and third codon positions. Nonsynonymous occur in the second position. ds/dn < 1indicates positive natural selection. ds, dn - # of (non)synonymous substitutions per (non)synonymous site
Measures of evolutionary distance between amino acid sequences. Evolutionary distance is usually measures by the number of amino acid substitutions. • P-distance. nd – number of amino acid differences between two sequences; n – number of aligned amino acids.
Poisson correction for evolutionary distance. Takes into account multiple substitutions and therefore is proportional to divergence time. PC-distance – total # of substitutions per site for two sequences
Gamma-distance. Substitution rate varies from site to site according to gamma-distribution. a – gamma-parameter, describing the shape of the distribution, =0.2-3.5. When P<0.2, there is no need to use gamma-distance.
Estimation of evolutionary rates in hemoglobin alpha-chains. To estimate the evolutionary rate of divergence between human and cow (time of divergence between these groups is ~90 millions years), r = 0.129 / (2*90*10^6) = 0.717*10^-9 per site per year.
Another method to estimate evolutionary distances: amino acid substitution matrices. Substitutions occur more often between amino acids of similar properties. Dayhoff (1978) derived first matrices from multiple alignments of close homologs. The number of aa substitutions is measured in terms of accepted point mutations (PAM) – one aa substitution per 100 sites. Dayhoff-distance can be approximated by gamma-distance with a=2.25.
Fixation of mutations. Not all mutations are spread through population. Fixation – when a mutation is incorporated into a genome of species. Majority of mutations are neutral (Kimura), do not effect the fitness of organism. Fixation rate will depend on the size of population (N), fitness (s) and mutation rate (μ):
Phylogenetic analysis. • Phylogenetic trees are derived from multiple sequence alignments. Each column describes the evolution of one site. • Each position/site in proteins/nucleic acids changes in evolution independently from each other. • Insertions/deletions are ususally ignored and trees are constructed only from the aligned regions.
The concept of evolutionary trees. - Trees show relationships between organisms. • Trees consist of nodes and branches, topology - branching pattern. • The length of each branch represents the number of substitutions occurred between two nodes. If rate of evolution is constant, branches will have the same length (molecular clock hypothesis). • Trees can be binary or bifurcating. • Trees can be rooted and unrooted. The root is placed by including a taxon which is known to branch off earlier than others.
Accuracies of phylogenetic trees. Two types of errors: • Topological error • Branch length error Bootstrap test: Resampling of alignment columns with replacement; recalculating the tree; counting how many times this topology occurred – “bootstrap confidence value”. If it is >0.95 – reliable topology/interior branch.
Methods for phylogenetic trees construction. Set of related sequences Multiple sequence alignments Strong sequence similarity? Maximum parsimony methods Yes No Recognizable sequence similarity? Yes Distance methods No Analyze reliability of prediction Maximum likelihood methods
1. Distance methods: Neighbor-joining method. NJ is based on minimum evolution principle (sum of branch length should be minimized). Given the distance matrix between all sequences, NJ joins sequences in a tree so that to give the estimate of branch lengths. • Starts with the star tree, calculates the sum of branch lengths. C B b c D a d e A E
Neighbor-joining method. 2. Combine two sequences in a pair, modify the tree. Recalculate the sum of branch lengths, S for each possible pair, choose the lowest S. C B c b d D a e A E 3. Treat cluster CDE as one sequence “X”, calculate average distances between “A” and “X”, “B” and “X”, calculate “a” and “b”. 4.Treat AB as a single sequence, recalculate the distance matrix. 5. Repeat the cycle and calculate the next pair of branch lengths.
Classwork I Given a multiple sequence, construct distance matrix (p-distance) and calculate the branch lengths. APTHASTRLKHHDDHH ALTKKSTRIRHIPD-H DLTPSSTIIR-YPDLH
Classwork II: NJ tree using MEGA. • Go to CDD webpage and retrieve alignment of cd00157 in FASTA format. • Import this alignment into MEGA and convert it to MEGA format http://www.megasoftware.net/mega3/mega.html . http://bioweb.pasteur.fr/seqanal/interfaces/protdist-simple.html 3. Construct NJ tree using different distance measures with bootstrap. 4. Analyze obtained trees.