Revolutionizing Data Visualization with RAVE: A Resource-Aware Approach
The RAVE (Resource-Aware Visualization Environment) project seeks to address the challenges of data visualization by providing a solution that accommodates various types of machines and promotes collaboration among users. This presentation outlines the pros and cons of current data visualization methods, introduces the RAVE project, and showcases its innovative components designed for user-friendly interaction with complex datasets. By offering multi-user access, resource sharing, and seamless data distribution, RAVE empowers researchers to visualize and interpret simulations effectively while overcoming existing limitations.

Revolutionizing Data Visualization with RAVE: A Resource-Aware Approach
E N D
Presentation Transcript
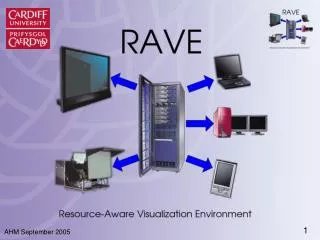
RAVE:Resource-AwareVisualization EnvironmentDr. Ian J. GrimsteadProf. Nick J. Avis Prof. David W. WalkerCardiff School of Computer ScienceCardiff, Wales, UK
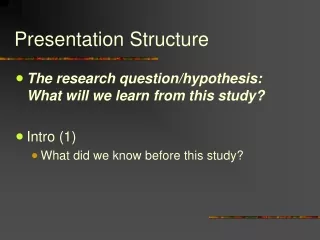
Presentation Structure • Data Visualization: Pros and Cons • A Solution: The RAVE project • Demonstration of RAVE • How RAVE works • Latest results • Conclusion
...or too little Too much info... Data Visualization:Simulations • Test theories without physically building • Cheaper to construct new tests • Can run overnight without human intervention • Simulations produce lots of information • But - hard to understand...
Image courtesy of IBM Research Generated with IBM Open Visualization Data Explorer Data Visualization:Comprehension • Solution–graphical visualization of data • View a model of the data, not the data • Massachusetts Bay • Colours, contours,... • Easier to comprehend • Data is now interactive
Data Visualization:Machine Dependence • System is often single platform • Microsoft vs. UNIX vs. Apple Mac vs. ... • Handheld vs. workstation vs. ... • Need to buy more copies of the system!
Data Visualization:Multiple Users • Hard to collaborate with other users • Usually – must all crowd around one machine • Unless a large display is available • One person “driving” – others are passive • System is not assisting with collaboration
Data Visualization:Specialist Equipment • May require specialist computer • Capable of displaying complex data • Prohibitively expensive to own • User may need to move to machine • Problem if only one machine • Overloaded – too slow to be usable • All displays are in use • What if it breaks?
Data Visualization:Summary • Pros: • Can comprehend much more information • Data is now interactive • Cons: • Restricted to specific machine/platform • May require specialist computer • Hard for users to collaborate
A Solution:The RAVE Project • RAVE supports: • Various types of machine/display • Immersadesk → workstation → PDA • Multiple machines/resources • Resource-aware: network, machine load • Multiple users • Resource sharing • Collaboration • RAVE is now demonstrated...
Demonstration • Recorded demo • Resources: • Windows laptop (active clients, Java) • Remote Linux/Solaris/IRIX servers • Data servers • Uses: • WeSC UDDI server • WeSC Service-Orientated Grid
The RAVE Project:How it Works • Each RAVE component now examined: • Data Distribution - Data Server • Displaying the Data - Active Client • Lightweight clients - Render Server, Thin Client • Service Discovery • Tiled rendering with Active Client • Remote (dynamic) data feed
Internet or remote machine RAVE Client RAVE Client RAVE Client Visualization Data Data to be visualised Data Server Data Distribution • First component: Data Server • Acts as a distribution point & interpreter • Understands many types of data • Uses Java3D+Xj3D as importer
Visual drawn on local machine Visualization Data Data Server Isosurface of MRI from Large Geometric Models Archive (~850kpoly, 3 nodes, 19.8Mb raw data) Bootstrap DS→AC: 12.4s Note: Windows XP Diffusion Tensor Imaging, SHEFC Brain Imaging Research Centre for Scotland, Martin Connell and Mark Bastin (~950kpoly, 2200 nodes, 29.8Mb raw data) Bootstrap DS→AC: 20.9s Geology dataset (10 minute ETOPO from National Geophysical Data Center (~4.6Mpoly, 3 nodes, 109.6Mb raw data) Bootstrap DS→AC: 48.3s Displaying the Data • Second component: Active RAVE Client • “Active” – facilities to draw on its own • Accepts feed from Data Server • Presents images of data to user Active RAVE Client
Lightweight Clients Visual drawn off-screen (hidden) Visual Interaction Visualization Data Render Server Thin Client Data Server MolScript VRML of 1PRC molecule (Research Collaboratory for Structural Bioinformatics – Protein Data Bank) (~546kpoly, 29,000 nodes, 23.2Mb raw data) 96.5s DS→RS (# nodes) 3.2fps @ 400x400 (11Mbit shared wireless) Isosurface of MRI scan Large Geometric Models Archive (~850kpoly, 3 nodes, 3.2fps @ 400x400 11Mbit wireless) • Third component: the Render Server • Drawn visual sent to Thin RAVE Clients • “Thin”-insufficient power/resources to draw data
Service Discovery • Servers are “advertised” on the network • Using standardised methods • UDDI, Grid/Web Services • We can reuse the work of other people • UDDI4J, Apache Axis, Globus • Human user can see list of servers • Select most appropriate one • Consider speed, memory, bandwidth... • May already have your required data on it • Or automatically select with a heuristic
Remote, Dynamic Data • Independent simulation can supply Data Server • Simulation code instrumented • Transmits scene creation to Data Server • Subsequent updates also sent • Data Server reflects updates • Multiple clients can view live simulation
UDDI Server Search for RS Drawn Visual Render Server Render Server Available RS Drawn Visual Tiled Rendering • If your machine can nearly cope: • Request assistance from a Render Service • Automatically select RS with heuristic • Locally render subset (tile) of data • Remainder rendered by Render Server Visualization Data Active Client Data Server
Tiled Rendering:Latest Results Tiling advantage @ 600kv? Perfectly tri-stripped ~29,000 nodes; ~2.2 v:p ~1.3 v:p
Tiled Rendering:Discussion • Is it worth it? • Only in specific circumstances: • When GPU fillrate is local bottleneck • T&L constant between 50% and 100% • Sufficient network bandwidth available • Examples: • Hand dataset – perfectly tristripped • GPU T&L not bottleneck 200% speedup • 1PRC – hardly tristripped (2.2 verts/poly) • GPU T&L bottleneck 20% slowdown
RAVE: Summary • Data Server reads data and distributes • Active Client renders locally • Thin Client renders via Render Server • Active Client may request assistance • All resources shared where possible • Uses Java to support (most) platforms
Conclusion • Visualization – great! • But requires specialist hardware or software • Often not designed for multiple users • Solution - “RAVE” • Utilise any available machines/resources • Collaborative – work from your desk • Further information: • http://www.wesc.ac.uk/projectsite/rave/
Acknowledgements • Project funding: UK DTI & SGI • Diffuse Tensor Imaging dataset: • Martin Connell and Mark Bastin, SHEFC Brain Imaging Research Centre for Scotland • Molecule geometry: • Research Collaboratory for Structural Bioinformatics Protein Data Bank, using MolScript • Skeletal hand: • Large Geometric Models Archive, Georgia Institute of Technology • ETOPO dataset: • National Geophysical Data Center (NGDC)