Download
1 / 36
370 likes | 546 Vues
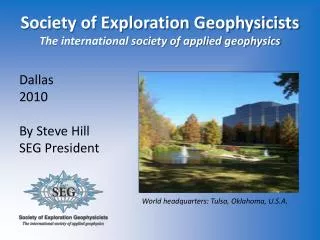
Society of Exploration Geophysicists The international society of applied geophysics. Dallas 2010 By Steve Hill SEG President. World headquarters: Tulsa, Oklahoma, U.S.A. SEG Priorities. Serve a global membership Accelerate innovation Inspire the geoscientists of tomorrow.

E N D
Society of Exploration GeophysicistsThe international society of applied geophysics Dallas 2010 By Steve Hill SEG President World headquarters: Tulsa, Oklahoma, U.S.A.
SEG Priorities • Serve a global membership • Accelerate innovation • Inspire the geoscientists of tomorrow
SEG Principles/Values Geophysics to the core. Border free. Member-driven. Level playing field. Investing in future: Technology & Students. Running a business.
May Executive Committee Meeting • Revision to SEG Constitution and Bylaws. • Budget (~$15,000,000) • Executive Director Interviews • Increase Real Estate Investment
Constitution & Bylaws Challenge Articles of Incorporation SEG governed by Executive Committee & Constitution Constitution SEG governed by Council
Informed Decision Challenge New-hire Executive Committee SEG Business: ~$15,000,000/year
Proposed Solution 15 – 25 Member Board 2-3 year overlapping terms Executive Committee 2-3 year overlapping terms
Geophysics Bright Spots Geophysics Bright Spots? Best articles?
Understandable? Real data? Good graphic? Succinct concept? Geophysics Bright Spots Yes
Seismic Interferometry California earthquake monitoring stations. Real energy source = Ocean waves Virtual energy sources = Each receiver location Eric Larose, et al., Correlation of random wavefields: an interdisciplinary review
Seismic Interferometry Tomographic, virtual-source, Rayleigh-wave velocity inversion Eric Larose, et al., Correlation of random wavefields: an interdisciplinary review
Seismic Interferometry Lateral Position Depth Virtual-source imaging below Complex overburden. Andrey Bakulin and Rodney Calvert, The Virtual Source method: theory and case study
Seismic Interferometry Lateral Position Depth Time-lapse comparison of migrating virtual-source, VSP data. Production-related, differential compaction across fault. Depth Andrey Bakulin and Rodney Calvert, The Virtual Source method: theory and case study
Surface S & downhole R using virtual downhole S. Image with downhole S & R Model Mark E. Willis , et al., A novel application of time-reversed acoustics: Salt dome flank imaging using walk away VSP surveys
Charging a Hydrocarbon Reservoir Lateral Position Downward electrical impulse. “Charges” reservoir. Longer delay times imply hydrocarbons. Depth Charge relaxation time Sofia Davydycheva, Nikolai Rykhlinski, and Peter Legeido, Electrical prospecting method for hydrocarbon search using the induced polarization effect
Automatic Fault Picking Adjacent trace dissimilarity reveals faults. Israel Cohen , Nicholas Coult and Anthony A. Vassiliou, Detection and Extraction of Fault Surfaces in 3-D Seismic Data
Prestack Inversion for Impedance Gulf of Mexico, deep-water data. Hydrocarbons decrease impedance. Seismic data inversion for impedance reveals lateral extent of reservoir. Inversion ties well. Arturo Contreras , Carlos Torres-Verdín, and Tim Fasnacht, AVA simultaneous one-dimensional inversion of partially-stacked seismic amplitude data for the spatial delineation of lithology and fluid units of deepwater hydrocarbon reservoirs in the central Gulf of Mexico
Ground-penetrating Radar for Archeology Depth model Goal: Find 1,500-year-old buried walls Solution: Ground-penetrating radar. Clay walls in sandy soil. Digging confirmed structures. Model data Real data “Joint geoelectrical and GPR prospecting at the ancient Palo Blanco archaeological site, NW Argentina, Martino et al .)
Unstable Mountain Slope Mountain slope above town of Randa in Matter Valley (Switzerland). Fracturing lowers P-wave velocity. Velocity map from 3D, P-wave, tomographic inversion. Found larger lateral extent of rock moving 1 – 2 cm/year towards town. “Characterizing an unstable mountain slope using shallow 2- and 3-D seismic tomography”, Heincke et al
Hydraulic Fracturing Monitoring Downhole, 3-C geophones Hydraulic fracturing produces microseismic events. Record events at 3-C geophones. Triangulate to estimate event origin Estimate direction of frac job. Fast location of seismicity: a migration-type approach with application to hydraulic fracturing data, by Susanne Rentsch et al.)
Electromagnetic-to-seismic Conversion Apply surface voltage. Contrast in subsurface electrical properties due to hydrocarbon-induced resistivity change creates discontinuous electric field. Induces pressure gradient in rock, creating P-wave, revealing hydrocarbons. “Field tests of electroseismic hydrocarbon detection”, A. H. Thompson et a l.)
Gravity Inversion for Basement Author’s inversion for basement from gravity data, including interpretation of salt location. “2D gravity inversion of a complex interface in the presence of interfering sources” by Silva Dias et al
3D Frequency Display Fit series of Ricker wavelets, subtracting each in turn. Ricker wavelets provide frequency information. Frequency (color) proportional to thickness. Coherence attribute defines edges (grey). Instantaneous spectral attributes to detect channels” by Liu and Marfurt
Acoustic Logging while Drilling Record interface reflections as drill bit approaches interface. Useful for guiding drill bit within reservoir interval. “Processing array acoustic logging data to image near-borehole geological structures” by Tang et al.
Contaminant Location Grey = presumed creosote location by other techniques. Goal: Find the creosote in North Carolina. Creosote sunk through water column until hits low-permeability zone. Creosote has lower frequency-dependent absorption of ground-penetrating radar. “Frequency dependent attenuation analysis of ground-penetrating radar data” by John H. Bradford .
Image Gas Storage Lateral Position Depth Time-varying current between two electrodes. Measure time-varying voltage away from source electrodes Invert for resistivity. Red = High resistivity gas. Black = Known top gas. “Multi-Transient Electromagnetic Demonstration Survey in France” by Anton Ziolkowski et al.
Underwater Rail Tunnel 3-C onshore passive seismic. Sources are 150 earthquake events. Inverted for P-wave velocity. Imaged high-velocity evaporite under strait. Drilling confirmed its existence. High-velocity evaporite
Multi-azimuth Acquisition 3D, Gulf of Mexico density model used to create simulated acquisition traces. “Using 3D finite-difference modeling to design wide-azimuth surveys for improved subsalt imaging” by Carl J. Regone.
Multi-azimuth Acquisition 3D, prestack depth migration of synthetic, narrow-azimuth data. “Using 3D finite-difference modeling to design wide-azimuth surveys for improved subsalt imaging” by Carl J. Regone
Multi-azimuth Acquisition 3D, prestack depth migration of synthetic, wide-azimuth data. “Using 3D finite-difference modeling to design wide-azimuth surveys for improved subsalt imaging” by Carl J. Regone