Download
1 / 20
200 likes | 485 Vues
Sustainable Development and Low Carbon Growth Strategy for India. Kirit S. Parikh Chairman, Integrated Research and Action for Development Chairman, Expert Committee on Low Carbon Strategy for Inclusive Growth. The Background.

E N D
Sustainable Development and Low Carbon Growth Strategy for India Kirit S. Parikh Chairman, Integrated Research and Action for Development Chairman, Expert Committee on Low Carbon Strategy for Inclusive Growth
TheBackground • India’s economy needs to grow at 8 % to 10 % per year for two to three decades to meet its human development needs. • Growth coupled with growing population puts significant stress on natural resources & environment. • Major threat to sustainability of India’s development arises from energy use. • Per capita consumption of energy in India is one of the lowest in the world. India consumed 530 kg of oil equivalent (kgoe) per person of primary energy in 2007 compared to 1480 in China, 7750 in the U.S. and the world average of 1820 • 84% of the 160 million rural households, 23% of the 72 million urban households cook with biomass based solid fuels
India’s Energy Needs, Resources and OptionsTotal Primary Energy Supply in 2007 • .
Commercial Energy Requirement, Domestic Production and Imports for 8 percent Growth: Base scenario • Potential for nuclear power is limited.By 2030, it can at most contribute 7 to 8 % of electrical energy. • Bio fuels are limited by the availability of cultivable land • Solar power has substantial potential. • The low hanging fruit is energy efficiency
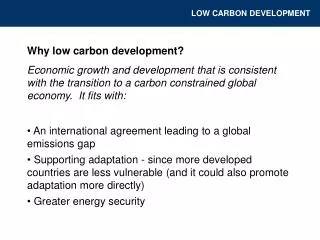
India’s GHG Emissions in the Global Context • The total GHG emissions from India in 2007 were 1727.7 million tonnes of CO2 equivalent. • India’s total CO2 emissions in 2007 were less than one fifth that of USA and China. • In per capita terms India emitted 1.18 tonnes of Co2, China four times as much and US 16 times as much. • Emission intensity of India is 0.28 kg of CO2/$ of GDP in purchasing power parity (PPP) terms, China’s more than twice as high and USA’s also nearly twice as high.
Energy Related Cumulative CO2 Emissions • India’s contribution since 1850 to global emissions is only 2.4 percent while that of USA is 29 percent. • Since 1990, India’s share is 4 percent in emissions, China’s 15 percent and USA’s 23 percent.
Electricity accounts for 38 percent of the GHG emissions in 2007. Agriculture accounts for 18 percent of the GHG emissions The Structure of India’s EmissionsGHG emissions by sector
The electricity sector accounted for 51 per cent. 10 percent of the CO2 emission was from the transport sector. Manufacturing industries together accounted for 29 per cent. CO2 Emission Distribution across Sectors in 2007.
TableContinued on the next slide…. Emissions in 2020 with 8 % growth rate as per 2005 intensity and Reductions in MT CO2 and per cent
Projected Emission Intensity Reduction over 2005 levels • Emission intensity reduction of around 24.44 % with determined effort and 34.4 % with aggressive effort compared to 2005. • Emission intensity reduction of around 23.88 % with determined effort and 33.27 % with aggressive effort compared to 2005.
Policy Options Promoting Energy Efficiency Lighting • A compact fluorescent lamp (CFL) • costs 7 to 10 times as much as IL • An LED lamp consumes even less of electricity than a CFL but costs much more . Energy Efficient Appliances • Energy rating scheme. • The label - electricity consumed and energy efficiency. • Private individuals and firms can buy on Life cycle cost. • But not procurement officers of public sectors firms or government departments buy on first cost basis
Rating and Characteristics of a 1.5 ton Air-conditioner (used 4 hours a day)
Present Discounted value in Rupees of saving over no star model over 5 years at discount rate.
Promoting Energy Efficiency in Industry • Concentrating on new industries to set up energy efficient plants is an attractive option. • Labeling for industrial equipment, such as variable speed drives, can be effective if energy prices are competitively determined. • Trade parity prices for fuels. • Perform achieve and trade (PAT) is being introduced for industries.It covers only some 700 large firms • The BEE is examining some 25 clusters to see how there SMEs can be incentivized to improve energy efficiency.
Electricity Supply • National Solar Mission to make Solar Electricity cost competitive to coal based electricity by 2020 or latest by 2030. • Firms are required to bid for the feed in tariff they need and the first auction has already lowered the feed in tariff to Rs 15/ kWhr from the ceiling of Rs 15. • State electricity regulatory commissions announced renewable portfolio obligation and the certificates can be traded, for which power exchanges provide electronic trading platforms. Energy Conservation in Buildings • Appropriate design using natural sunlight and appropriate orientation, insulation and natural sources of cooling and heating. • BEE in India enacted an energy conservation building code (ECBC).
Transport • The stock of automobiles has been growing at more than 20 % in recent years and two wheelers even faster. • Shift long distance freight movement from trucks to trains: Moving a billion tonne-km of goods by rail compared to road can save 30 Mt of diesel and save 54 Mt of Co2 . • Improve mass transport in urban areas of quality that induces vehicle owners to travel by it • Design cities that reduce need for travel and encourage walking and cycling • Improve fuel efficiency of vehicles
Conclusion • For sustainable development, manage resources and environment well • Improve energy use efficiency • Encourage renewable sources of energy • India can reduce by 2020 its emission intensity by 25 % compared with 2005 as was declared at Copenhagen. Thank You