Integrating Public Transport and Urban Planning in Tshwane: A Strategic Approach
120 likes | 223 Vues
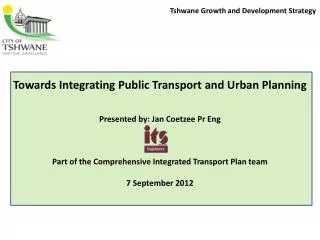
The Tshwane Growth and Development Strategy aims to integrate public transport with urban planning. Presented by Jan Coetzee on September 7, 2012, this strategy addresses the growing private vehicle ownership and the challenges posed by existing infrastructure. With 2100 km of gravel roads and a vast geographical area, Tshwane faces unique transport challenges. The approach includes political will, organizational cooperation, and realistic targets to promote effective public transport utilization and sustainable urban development over the next generation.

Integrating Public Transport and Urban Planning in Tshwane: A Strategic Approach
E N D
Presentation Transcript
Tshwane Growth and Development Strategy Towards Integrating Public Transport and Urban Planning Presented by: Jan Coetzee PrEng Part of the Comprehensive Integrated Transport Plan team 7 September 2012
Which statement is true for Tshwane Residents ? 1. Owning and driving a car is convenient, and a status symbol 2. Driving with your car to work has become socially and morally unacceptable
Facts about South Africa / Tshwane • Private vehicle ownership will grow (per capita of the population) as people become more affluent • Public Transport utilization in SA is high compared to developed countries – due to captive market and is likely to go down • The existing environment makes it difficult to implement new policies / strategies – Taxi industry, settlement patterns, social and political structure • Tshwane has 2100 km of gravel roads in residential areas – will cost R 6,5 billion to pave • Tshwane covers a large geographical area – approximately 100 km north-south and 120 km east-west • All role players underestimate the time it takes to implement travel behavior changes – it takes a generation • (Gautrain was conceptualized in 1997, 15 years ago)
Car ownership in SA SA 2002, 152 veh / 1000 SA 1962, 66 veh/100 Source: Vehicle Ownership and Income Growth, Worldwide: 1960-2030, Joyce Dargay, Dermot Gately and Martin Sommer, January 2007
Travel Time Surveys Surveys done for Tshwane show speeds of less than 30 km/h during the morning peak hour (red)
What should our Modal split be • Germany: 60% by car, Public Transport 8%, Cycle 9%, Foot 23% • America 89% by car, 8% on foot, 2% public transport and 1 % bicycle • Source: “Determinants of Transport mode choice: A comparison of Germany and the USA, Ralph Buehler • In SA Public transport in Cities is more than 50% - as high as 70%. Although a captive market – we will have to do everything we can to keep it there
What is necessary to ensure integration of land use and public transport • Political will • Organizational Structure within City Departments – facilitate integration and co-operation • Legislation and by laws • Monitoring and control • Realistic targets • Avoid blindly following trends / perceptions – MCDC corridor ?? • BRT ?
Toolbox – Integrating Public Transport and Urban Planning (1 / 2)
Toolbox – Integrating Public Transport and Urban Planning (2 / 2)
Proposed Light Rail / BRT Ring route Mamelodi CBD Irene
Thank you We normally overestimate what will happen in 1 year, and we underestimate what will happen 10 years. Bill Gates, Microsoft jan@itse.co.za