Download

1 / 108
1.12k likes | 1.35k Vues
Systems Thinking and the Theory of Constraints. The “Job-Shop” Simulation. 4 types of products. Product #1. Product #2. B. Start. B. Start. Finish. Finish. A. D. A. D. C. C. Product #3. Product #4. Finish. B. B. Start. Start. A. D. A. D. C. C. Finish.

E N D
The “Job-Shop” Simulation • 4 types of products Product #1 Product #2 B Start B Start Finish Finish A D A D C C Product #3 Product #4 Finish B B Start Start A D A D C C Finish
The “Job-Shop” Simulation • Objective: Produce “kits” of products • Each kit requires one job of each type • Number of days given to complete kits: 20 days • Scorecard: Teams will be “graded” based on: • No. of kits produced • Tie-breaker 1: Max. flow days • Tie-breaker 2: Total no. of products produced
The “Job-Shop” Simulation • What could we have done better? • Manage the bottleneck better, right? • How can we do that?
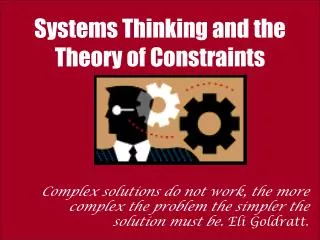
Systems Thinking • Integrated decision making • “Big Picture” Thinking • Thinking “Globally” rather than “Locally” • Understanding how localized decision making can affect the overall goal
The Theory of Constraints • Eli Goldratt, a physicist. • OPT: a scheduling package. • The Goal and the Theory of Constraints. • TOC provides a way of thinking globally. • Goldratt challenges the conventional approach to managing organizations.
Traditional Decision Making The “Cost World” Perspective
Traditional Decision Making • How are investment decisions usually made? • Usually based on cost considerations (right)? • “The Cost-World” Perspective • Consider how the cost-world perspective affects the push towards parts per million (PPM) quality and “Zero” inventory.
The Cost World Perspective: Cost and PPM Quality $60,000 $20,000 8% 2% $15,000 $20,000 2% 0.5% $4,000 $20,000 0.5% 0.1%
The Cost World Perspective: Cost and Inventory Turns * Assuming starting inventory of $15M and 25% carrying cost
The Real Cost of Inventory • Inventory adversely affects all the factors that give you a competitive edge (namely, Price, Quality, and Delivery). Higher inventory leads to: • Longer lead times and poorer delivery performance, • Defects not being detected soon enough, • Increased costs due to obsolescence, storage costs, overtime, etc.
Traditional Decision Making Inventory Valuation and Cost Accounting
An Inventory Conundrum Raw Material cost per unit: $10 WIP value per unit: $20 Finished Goods value per unit: $35 Sale Price per unit: $50 Other Operating Expenses: $4 Million in 2006; $3.75 Million in 2007 2006 2007 Beginning WIP Inventory (1000 units) 50 50 Beginning FG Inventory (1000 units) 40 40 Raw Material (1000 units) 400 330 Sales (1000 units) 400 400 Ending WIP Inventory (1000 units) 50 10 Ending FG Inventory (1000 units) 40 10
An Inventory Conundrum: The Income Statement 2002 2007 Sales (1000 $) Beginning WIP Inventory (1000 $) Beginning FG Inventory (1000 $) Raw Material Purchase (1000 $) Other Expenses (1000 $) Ending WIP Inventory (1000 $) Ending FG Inventory (1000 $) Cost of Goods Sold (1000 $) Profit (1000 $) 20,000 20,000 1,000 1,000 1,400 1,400 4,000 3,300 4,000 3,750 1,000 200 1,400 350
Traditional Decision Making:Product Costs • How can we calculate a company’s profit? Net Profit = Sp Revenuep - Sc Expensec. But how do we use this information to, say, decide on launching a new product? • Allocate! If we allocate overhead costs correctly: Net Profitp = Revenuep - Expensep, and so, Net Profit = Sp Net Profitp
Obtaining Accurate Product Costs • How do we allocate overhead costs properly so that product costs are accurate? • Standard Costing • Activity Based Costing (ABC)
Exercise in Cost Accounting:Cromby, Steele and Nash, Inc. CSN, Inc. is a home maintenance services operation, started by three men, Cromby, Steele, and Nash. Services offered: Plumbing, Window Cleaning, Gutter Guard Installation, and Landscaping. There is ample demand for these services. However, there is also a shortage of qualified workers in the area. CSN has had a motto: “Teach Your Children Well,” ever since their young-er days. They have employed their children, 5 high-school graduates, to run operations.
CSN, Inc.: Labor Costs Monthly wage per employee = $2,000 including benefits Hours budgeted per employee per month = 200 hours Monthly capacity with 5 employees = 1,000 hours Total Direct Labor cost per month = $10,000 Direct labor rate = $10,000/1,000 = $10 per hour
Job Type Plumbing Window Cleaning Gutter Guards Landscaping Current Monthly Output Labor Hours/job 2 hours 90 jobs 70 jobs 4 hours 3 hours 80 jobs 60 jobs 5 hours Revenue/job $130 $170 $200 $250 Material Cost $30 $10 $70 $75 Labor Cost $20 $40 $30 $50 CSN, Inc.: Revenue & Cost Data Note: Total number of jobs per month = 90 + 70 + 80 + 60 = 300 jobs. At current output level, capacity used = 90 x 2 + 70 x 4 + 80 x 3 + 60 x 5 = 1,000 hours per month
CSN, Inc.: Overheads Monthly Administrative Overhead (Salaries) = $18,000. Monthly Non-Administrative Overhead (Rent, Truck Fleet Maintenance, Marketing, Depreciation) = $9,000. Overhead is currently allocated to products based on production volume. Current volume is 300 jobs per month. Administrative Overhead per job $18,000/300 = $60. Non-Administrative Overhead per job = $9,000/300 = $30.
Job Type Plumbing Window Cleaning Gutter Guards Landscaping Current Output Labor Hours/job 2 hours 90 jobs 70 jobs 4 hours 3 hours 80 jobs 60 jobs 5 hours Revenue/job $130 $170 $200 $250 Material Cost $30 $10 $70 $75 Labor Cost $20 $40 $30 $50 Administrative Overhead Allocation $60 $60 $60 $60 Non-Administrative Overhead Allocation CSN, Inc.: Summary Cost Table $30 $30 $30 $30
Cromby, Steele & Nash, Inc. CSN is using all its labor capacity, and is absorbing all overheads. So there is no labor variance or overhead absorption variance to worry about. Therefore, the total profit is: 90 x (-$10) + 70 x $30 + 80 x $10 + 60 x $35 = $4,100 per month.
CSN, Inc.: Activity-Based Costing CSN, Inc. wants to use a better method to allocate the overheads (usingActivity-Based Costing). To accurately allocate Administrative Overhead, CSN gathers data on the time the administrators, Cromby, Steele and Nash, devote to the four products, each month. The data reveals the following breakdown on the time administration spends on the 4 products: Plumbing: 30%; Window Cleaning: 35% Gutter Guards: 20%; Landscaping: 15%
Job Type Plumbing Window Cleaning Gutter Guards Landscaping Percentage Effort Admin O/H Allocated = %age effort x $18,000 $5,400 30% $6,300 35% $3,600 20% 15% Number of Jobs 90 jobs 70 jobs 80 jobs 60 jobs Administrative O/H Allocation per job $60 $90 $45 CSN, Inc.: Administrative Overhead Allocation using ABC Administrative Overhead to be allocated = $18,000
CSN, Inc.: Non-Administrative Overhead Allocation using ABC Non-Administrative Overhead to be allocated = $9,000. The allocation is made based on labor hours. Total labor hours = 1,000. So, Non-Admin. O/H rate = $9,000/1,000 = $9.00 per labor hour. Since Plumbing takes 2 hours, the Non-Admin. Overhead allocated to a Plumbing job is = $9 x 2 = $18. Thus the Non-Administrative Overhead allocation per job is: Plumbing (2 hours): $18; W. Cleaning (4 hours): $36 G. Guards (3 hours): $27; Landscaping (5 hours):
Job Type Plumbing Window Cleaning Gutter Guards Landscaping Labor Hrs./job Current Output 2 hours 90 jobs 70 jobs 4 hours 3 hours 80 jobs 60 jobs 5 hours Revenue/job $130 $170 $200 $250 Material Cost $30 $10 $70 $75 Labor Cost $20 $40 $30 $50 Administrative Overhead Allocation $60 $90 $45 $45 Non-Administrative Overhead Allocation CSN, Inc.: Improved Allocation with ABC $18 $36 $27
CSN, Inc., Demand for Services Suppose the monthly demand for these services is: Plumbing: 250 jobs Window cleaning: 160 jobs Gutter guard installs: 145 jobs Landscaping: 120 jobs Suppose, too, that CSN, Inc., can choose which products to go after. What is the best product offering for CSN, Inc., that will maximize its profit?
Cromby, Steele & Nash, Inc. Can CSN do better? Let’s use ABC cost figures. Which is the most profitable product? Compute profits if they first complete meeting the demand for the most profitable product, then focus on the next most profitable product, and so on. Use the following pages for your calculations.
Cromby, Steele & Nash, Inc. First complete demand for 120 Landscaping jobs. That uses up , leaving of capacity. Next work on Gutter Guards. Each job takes 3 hours. With this product mix, the apparent profit seems to be:
CSN, Inc.: Reconciling Variances 120 Landscaping and 133 Gutter Guard jobs will each recover $45 of Administrative Overhead, that is: $45 x 120 + $45 x 133 = $11,385. Admin. Overhead Variance = The 1 hour of unused labor gives a Labor Usage Variance of $10 and Non-Admin. Overhead Variance of $9. So, the total of all the Variances is: Actual profit with ABC is thus: So, “optimal” profit is less than earlier profit! Why?
Systems Thinking and the Theory of Constraints The “Throughput World” Perspective
The Theory of Constraints • The Theory of Constraints (TOC) is based on two premises: • The Goal of a business is to make more money, … in the present and in the future. • A system’s constraint(s) determine its output.
TOC Performance Measures • Throughput (T): The rate at which the system generates money through sales. • Inventory (I): All the money invested in purchasing things needed by the system to sell its products. • Operating Expenses (OE): All the money the system spends, turning inventory into throughput.
The Goal: To Make Money • Bottom Line Measurements NET PROFIT (Absolute) RETURN ONINVESTMENT (Relative) CASH FLOW (Survival)
Return on = Net Profit = T - OE Investment “Inventory” I • Asset = Throughput = T Turns “Inventory” I Relating TOC Measures to Traditional Measures • Net Profit = T - OE • T = Sales Revenue - Variable Cost (Materials) • OE = Fixed Costs (DL + Overhead)
Priorities in Traditional World First: OE Second: T Distant Third: I
Where is the Bang for the Buck? (T vs. OE) Leverage from Decreasing OE Leverage from Increasing T $ Revenue 100 RM 40 DL 10 OH 40 Cost 90 NP 10 100 114 40 48 0.95(100) = 95 1.20(95) = 114 8 10 40 40 88 98 12 16 Assume a) you have 20% excess capacity, and b) sales will increase by 20% if you can effect a 5% price reduction.
Shifting Paradigms Current Priority First: OE Second: T Third: I New Priority T I OE
How to Make Money: The Importance of Throughput Lean Supply Chain Principle 12: Decisions should promote a growth strategy. While enterprises should try to simultaneously increase throughput, decrease inventory, and decrease operating expenses, the focus must be on improving throughput.
CSN, Inc.: A Better Approach • Consider only the variable costs in the profit equation – use marginal profits. • Focus on the constraint. Evaluate rate at which marginal profits are generated at the constraint (Throughput). Best product is the one with the highest Throughput. Complete demand on this product, move to next most profitable product, and so on, till you run out of capacity at constraint. • Find total marginal profit, and subtract out fixed costs to get total net profit.
Cromby, Steele & Nash, Inc. Capacity at the constraint (total labor hours) = 1,000 hours. Fixed costs are: Labor + Administrative O/H + Non-Admin. Overhead = $10,000 + $18,000 + $9,000 = $37,000.
Cromby, Steele & Nash, Inc. This approach is known as Throughput Accounting
CSN, Inc.: Summary Summary: Profit with arbitrary product mix: $4,100 “Optimal profit” with ABC: $ Optimal profit with Throughput Accounting: $
Systems Thinking and the Theory of Constraints The Job Shop Simulation Revisited
The “Job-Shop” Simulation Revisited Product #1 Product #2 Start B B Finish Start A D A D C C Finish Product #3 Product #4 B Finish B Start Start A D A D C C Finish Note: This is a different Job Shop
The “Job-Shop” Simulation • There are 4 operators. Each operator works 20 days a month at a salary of $2,400 per month. • The wage rate is set at $120 per operator per day. • Total labor cost is $9,600. • The overhead cost (salaries, depreciation, utilities, maintenance, etc.) adds up to $33,600 per month. • Overhead is allocated based on labor cost as follows: $33,600/$9,600 = 350% of direct labor cost.
Job Shop Simulation: Product Costs • Suppose material costs for the 4 products are: • Labor Cost is $120 per operator per day • Overheads are charged at 350% of direct labor cost • Selling price markup is 30% over total cost. • Which product(s) should the company focus on? Product 1: $1,500 Product 2 : $2,500 Product 3 : $2,500 Product 4 : $2,000
Profit Contribution Calculations for the 4 Products Product Matl. Cost (M) Labor (L) Over-head (O) Product Cost = M+L+O Sales Mark-up (%) Sales Price Contri-bution Which job(s) will make the company the most money? Rank them 1 3 1500 480 1680 3660 0.30 4758 1098 2 1236 2500 360 1260 4120 0.30 5356 2 3 1 2500 480 1680 0.30 6058 4660 1398 4 4 2000 360 3620 0.30 4706 1086 1260