Download
1 / 87
870 likes | 898 Vues
Learn about cardiovascular disease, blood pressure management, cholesterol levels, and diabetes prevention in this comprehensive guide. Take action today for a healthier future!

E N D
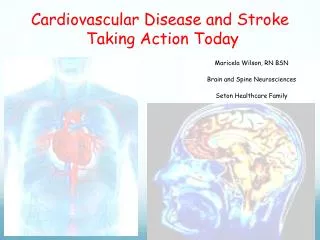
Cardiovascular Disease and Stroke Taking Action Today Maricela Wilson, RN BSN Brain and Spine Neurosciences Seton Healthcare Family
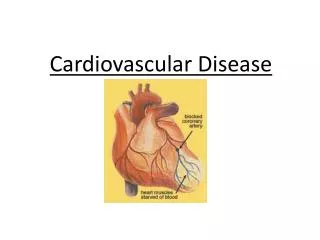
The Circulatory System • The circulatory system is made up of vessels and muscles that help and control the flow of the blood around the body. (This process is called circulation). • The main parts of the system are the heart, arteries, capillaries and veins.
SIX Modifiable Risk Factors for coronary risk factors • High blood pressure • High blood cholesterol • Diabetes • Physical inactivity • Overweight or obesity • Cigarette smoking
Risk Factors You Can’t Change Increasing age Family health history Race (HTN, Sickle cell) Previous heart attack or stroke Gender (male sex) menopause Birth control
Diabetes Cholesterol
American Heart Association Recommended Blood Pressure Levels systolic (mm Hg) Diastolic (mm Hg) _______________________________________ • Normal < 120 and < 80 • Pre-hypertension 120 –139 or 80-89 • High-Stage 1 140 –15 or 90–99 • High-Stage 2 160 + or 100 +
What Do Blood Pressure Numbers Mean? • Systolic pressure - force in arteries when the heart beats • Diastolic pressure - the heart at rest • It's measured in millimeters of mercury (mm Hg). • High blood pressure/hypertension) Classified : Essential or Secondary -Essential or primary B/P with unknown cause -Secondary hypertension is high B/P with a known direct cause, such as kidney disease, tumors, or birth control pills ( medication),etc.
Blood Pressure 1/2, 1/2, 1/2 • ½ of the people who have high blood pressure know they have it, • ½ of those who know they have it, are being treated for it. • ½ of those being treated for it, have their blood pressure under control. • Nationwide, about 25 percent of hypertensive patients who are controlling their blood pressure. • Adults B/P checked at least once every two years, • Optimal levels : (equal to or less than) 120 /80 mm Hg • If high: • Modify your lifestyle – Diet, Weight, Exercise, Salt restriction - Dash Diet ( Dietary Approaches to Stop Hypertension) http://www.nhlbi.nih.gov/health/public/heart/hbp/dash/new_dash.pdf • Adhere as prescribed– • Do not stop your medicines without consulting your doctor, even if the blood pressure becomes normal
Heart Disease and Stress • Excessive stress may precipitate the following • ^ blood pressure • ^fat and cholesterol • ^ deposition of fat in coronary arteries • Constriction of coronary arteries. • Increased chances of blood clotting. • Increased level of blood sugar.
Cholesterol ( A type of fat) • Everybody needs cholesterol, it serves a vital function in the body. • It circulates in the blood. • Too much cholesterol • can deposit in the • arteries in the form of • plaque and block them • No symptoms till heart • attack
Where does it come from ? 65% 35%
Cholesterol Levels People with high triglycerides often have a -High total cholesterol level - High LDL (bad) cholesterol -Low HDL (good) cholesterol levels.
High Cholesterol • HDL tends to carry cholesterol away from the arteries and back to the liver, where it's passed from the body. • HDL removes excess cholesterol from plaque in arteries, thus slowing the buildup. (About one third to one fourth of the total amount of cholesterol is HDL cholesterol) • LDL cholesterol circulates in the blood, slowly builds up in the inner walls of the arteries that feed the heart and brain. Together with other substances it can form plaque, a thick, hard deposit that can clog those arteries. This condition is known as atherosclerosis. If a clot forms and blocks a narrowed artery, it can cause a heart attack or stroke.
ADA Guidelines Non- Diabetic • Diabetics • Fasting Blood Sugar – 70-110 mg/dl, • Blood Sugar Before Meals – 90-130 mg/dl • Blood Sugar 1-2 Hours After Meals – < 180 mg/dl • Current trends are for even more strict guidelines. • If your fasting blood sugar is consistently over 110, then you have a problem and should be taking action, IMMEDIATELY, • Have your dr. order a Hemoglobin A1c HgbA1c < 7% (3 month history )
Diabetes Caused by too little insulin, resistance to insulin, or both. When glucose or sugar enters the blood stream the pancreas makes insulin Insulin moves glucose from the bloodstream into muscle, fat, and liver cells, to be used as fuel. People with diabetes have high blood sugar because their body cannot move sugar into fat, liver, and muscle cells to be stored for energy. This is because either: The pancreas does not make enough insulin Or the cells do not respond to insulin normally OR both of the above Insulin is a hormone produced by the pancreas to control blood sugar.
Diabetes • Data from the 2011 National Diabetes Fact Sheet (Jan. 26, 2011) • Total prevalence of diabetes: • 25.8million children and adults in the US • 8.3% of the population have diabetes. • Diagnosed:18.8 million people • Undiagnosed: 7.0 million people • Prediabetes:79 million people* • have a 2 or 3 x higher risk of heart attack or stroke • more likely to die of a heart attack • 80% die from heart disease • Risk of sudden death from a heart attack for a diabetic is the same as that of someone who already had a heart attack. • People at risk for diabetes who follow a diet and exercise plan & only a modest weight loss) can decrease their risk of developing diabetes by almost 50%
Myth : fat deposits at old age! It starts from 2 years of age Complicated Lesion/ Rupture Foam Cells Fatty Streak Intermediate Lesion Atheroma Fibrous Plaque From First Decade From Third Decade From Fourth Decade Adapted from Pepine CJ. Am J Cardio. 1998;82(suppl 104).
Abdominal Weight – Visceral Fat Excess of visceral fat is known as central obesity, or "belly fat", in which the abdomen protrudes excessively. • There is a strong correlation between central obesity and cardiovascular disease • Excess visceral fat is linked to -type 2 diabetesinsulin resistance -inflammatory diseases - and other obesity-related diseases Every pound of fat roughly 7 miles of capillaries.
BMI Waist-to-Height Ratio Doing the numbers, men should have a waist about 54% of their height, and women about 52%. You can figure out where you fall by dividing your waist measurement in inches by your height in inches (add 60 to the number of inches you are over 5 feet). http://home.fuse.net/clymer/bmi/
Family History • Gather information on your immediate family- • Learn about your extended family– • Gather family heart-health risk factor information conditions: Hypertension High cholesterol Smoking, Diabetes Overweight or obesity. • What heart or cardiovascular conditions have been diagnosed in family members? • Age of dx. • Examples include: • Aneurysm, Congestive heart failure, Coronary heart disease Heart attack (myocardial infarction),Stroke Irregular heartbeat (arrhythmia) • Heart muscle disease (cardiomyopathy)
Obesity Trends* Among U.S. AdultsBRFSS, 1985 (*BMI ≥30, or ~ 30 lbs. overweight for 5’ 4” person) No Data <10% 10%–14%
Obesity Trends* Among U.S. AdultsBRFSS, 1987 (*BMI ≥30, or ~ 30 lbs. overweight for 5’ 4” person) No Data <10% 10%–14%
Obesity Trends* Among U.S. AdultsBRFSS, 1988 (*BMI ≥30, or ~ 30 lbs. overweight for 5’ 4” person) No Data <10% 10%–14%
Obesity Trends* Among U.S. AdultsBRFSS, 1989 (*BMI ≥30, or ~ 30 lbs. overweight for 5’ 4” person) No Data <10% 10%–14%
Obesity Trends* Among U.S. AdultsBRFSS, 1990 (*BMI ≥30, or ~ 30 lbs. overweight for 5’ 4” person) No Data <10% 10%–14%
Obesity Trends* Among U.S. AdultsBRFSS, 1992 (*BMI ≥30, or ~ 30 lbs. overweight for 5’ 4” person) No Data <10% 10%–14% 15%–19%
Obesity Trends* Among U.S. AdultsBRFSS, 1993 (*BMI ≥30, or ~ 30 lbs. overweight for 5’ 4” person) No Data <10% 10%–14% 15%–19%
Obesity Trends* Among U.S. AdultsBRFSS, 1994 (*BMI ≥30, or ~ 30 lbs. overweight for 5’ 4” person) No Data <10% 10%–14% 15%–19%
Obesity Trends* Among U.S. AdultsBRFSS, 1995 (*BMI ≥30, or ~ 30 lbs. overweight for 5’ 4” person) No Data <10% 10%–14 15%–19%
Obesity Trends* Among U.S. AdultsBRFSS, 1996 (*BMI ≥30, or ~ 30 lbs. overweight for 5’ 4” person) No Data <10% 10%–14% 15%–19%
Obesity Trends* Among U.S. AdultsBRFSS, 1997 (*BMI ≥30, or ~ 30 lbs. overweight for 5’ 4” person) No Data <10% 10%–1 15%–19% ≥20%
Obesity Trends* Among U.S. AdultsBRFSS, 1998 (*BMI ≥30, or ~ 30 lbs. overweight for 5’ 4” person) No Data <10% 10%–14% 15%–19% ≥20%
Obesity Trends* Among U.S. AdultsBRFSS, 1999 (*BMI ≥30, or ~ 30 lbs. overweight for 5’ 4” person) No Data <10% 10%–14 1 15%–19% ≥20%
Obesity Trends* Among U.S. AdultsBRFSS, 2000 (*BMI ≥30, or ~ 30 lbs. overweight for 5’ 4” person) No Data <10% 10%–14% 15%–19% ≥20%
Obesity Trends* Among U.S. AdultsBRFSS, 2001 (*BMI ≥30, or ~ 30 lbs. overweight for 5’ 4” person) No Data <10% 10%–14% 15%–19% 20%–24% ≥25%
Obesity Trends* Among U.S. AdultsBRFSS, 2002 (*BMI ≥30, or ~ 30 lbs. overweight for 5’ 4” person) No Data <10% 10%–14% 15%–19% 20%–24% ≥25%
Obesity Trends* Among U.S. AdultsBRFSS, 2003 (*BMI ≥30, or ~ 30 lbs. overweight for 5’ 4” person) No Data <10% 10%–14% 15%–19% 20%–24% ≥25%
Obesity Trends* Among U.S. AdultsBRFSS, 2004 (*BMI ≥30, or ~ 30 lbs. overweight for 5’ 4” person) No Data <10% 10%–14% 15%–19% 20%–24% ≥25%
Obesity Trends* Among U.S. AdultsBRFSS, 2005 (*BMI ≥30, or ~ 30 lbs. overweight for 5’ 4” person) No Data <10% 10%–14% 15%–19% 20%–24% 25%–29% ≥30%
Obesity Trends* Among U.S. AdultsBRFSS, 2005 (*BMI ≥30, or ~ 30 lbs. overweight for 5’ 4” person) No Data <10% 10%–14% 15%–19% 20%–24% 25%–29% ≥30%
Obesity Trends* Among U.S. AdultsBRFSS, 2006 (*BMI ≥30, or ~ 30 lbs. overweight for 5’ 4” person) No Data <10% 10%–14% 15%–19% 20%–24% 25%–29% ≥30%
Obesity Trends* Among U.S. AdultsBRFSS, 2007 (*BMI ≥30, or ~ 30 lbs. overweight for 5’ 4” person) No Data <10% 10%–14% 15%–19% 20%–24% 25%–29% ≥30%
Obesity Trends* Among U.S. AdultsBRFSS, 2008 (*BMI ≥30, or ~ 30 lbs. overweight for 5’ 4” person) No Data <10% 10%–14% 15%–19% 20%–24% 25%–29% ≥30%