Data Analysis: Mean, Median, and Mode Explained
Learn how to find and understand the mean, median, and mode of a dataset with clear examples and step-by-step explanations. Enhance your statistical skills easily!

Data Analysis: Mean, Median, and Mode Explained
E N D
Presentation Transcript
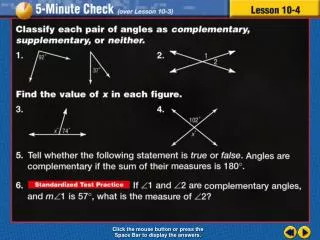
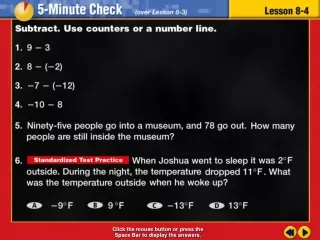
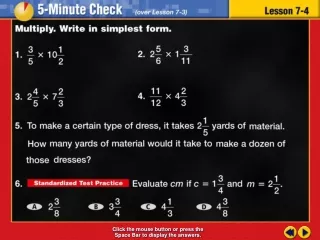
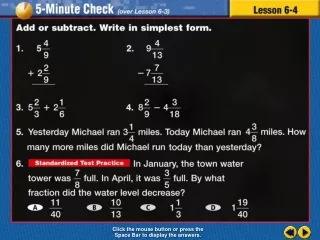
Transparency 4 Click the mouse button or press the Space Bar to display the answers.
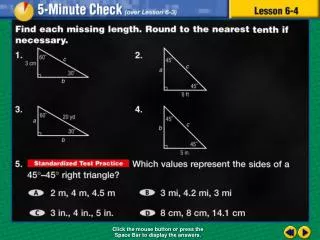
Example 4-3b Objective Find the mean, median, and mode of a set of data
Example 4-3b Vocabulary Measures of Central Tendency Used to describe the center of data Most Common Mean Median Mode
Example 4-3b Vocabulary Mean The sum of the data divided by the number of items in the data set
Example 4-3b Vocabulary Median The middle number of the ordered data (odd number of data set) Or The mean of the middle 2 numbers (even number of data set)
Example 4-3b Vocabulary Mode The number(s) that occur most often
Lesson 4 Contents Example 1Find the Mean Example 2Find the Mean, Median, and Mode Example 3Analyze Data 1/3
Number of Species in Major U.S. Zoos 300 400 283 400 175 617 700 700 715 280 800 290 350 133 400 195 347 488 435 640 232 350 300 300 400 705 400 800 300 659 Source: The World Almanac Example 4-1a ANIMALSThe table below shows the number of species of animals found at 30 major zoos across the United States. Find the mean. 1/3
Example 4-1a 300 400 283 400 175 617 700 700 715 280 800 290 350 133 400 195 347 488 435 640 232 350 300 300 400 705 400 800 300 659 Add the data in each column Put sum of columns in equation Count the number of pieces of data and put in the denominator 2,554 2,283 2,921 2,487 2,849 Mean = sum of data pieces of data Mean = 2,849 + 2,487 + 2,921 + 2,283 + 2,554 30 1/3
Answer:Mean = Example 4-1a 2,849 + 2,283 + 2,921 + 2,554 2,487 + Mean = 30 Add the numerator Bring down denominator Mean = 13,094 30 Divide Mean = 436.466666. . . 1/3
Nightly Hours of Sleep 7 8 6 7 8 9 5 6 7 7 8 6 7 8 8 Answer: Mean = Example 4-1b SLEEPThe table below shows the results of a survey of 15 middle school students concerning the number of hours of sleep they typically get each night. Find the mean. hours 1/3
2002 Winter Olympics: Gold Medals Won 12 6 4 3 0 10 6 4 2 3 11 2 3 4 2 1 1 0 2 2 1 0 0 0 0 Source: CBSSportsline.com Example 4-2a OLYMPICSThe table below shows the number of gold medals won by each country participating in the 2002 Winter Olympic games. Find the mean, median, and mode of the data. 2/3
12 6 4 3 0 10 6 4 2 3 11 2 3 4 2 1 1 0 2 2 1 0 0 0 0 Example 4-2a Add the data in each column Count the pieces of data 11 + 7 35 + 15 + 11 + Mean = 25 79 Mean = Add the numerator 25 Bring down denominator Mean = 3.16 Divide 2/3
Example 4-2a 2002 Winter Olympics: Gold Medals Won 12 6 4 3 0 10 6 4 2 3 11 2 3 4 2 1 1 0 2 2 1 0 0 0 0 Source: CBSSportsline.com OLYMPICSThe table below shows the number of gold medals won by each country participating in the 2002 Winter Olympic games. Find the mean, median, and mode of the data. 2/3
Example 4-2a 12 6 4 3 0 10 6 4 2 3 11 2 3 4 2 1 1 0 2 2 1 0 0 0 0 Median: Place numbers in order from least to greatest (make sure you use all numbers 0, 0, 0, 0, 0, 0, 1, 1, 1, 2, 2, 2, 2, 2, 3, 3, 3, 4, 4, 4, 6, 6, 10, 11, 12 There are 25 numbers so find the middle number which is 12.5 Divide 25 by 2 2/3
Example 4-2a 12 6 4 3 0 10 6 4 2 3 11 2 3 4 2 1 1 0 2 2 1 0 0 0 0 Since 25 divided by 2 is 12.5 , use the whole number 12 Median = 2 0, 0, 0, 0, 0, 0, 1, 1, 1, 2, 2, 2, 2, 2, 3, 3, 3, 4, 4, 4, 6, 6, 10, 11, 12 Place a line under the first 12 numbers Place a line under the last 12 numbers The number not underlined is the median 2/3
Example 4-2a 2002 Winter Olympics: Gold Medals Won 12 6 4 3 0 10 6 4 2 3 11 2 3 4 2 1 1 0 2 2 1 0 0 0 0 Source: CBSSportsline.com OLYMPICSThe table below shows the number of gold medals won by each country participating in the 2002 Winter Olympic games. Find the mean, median, and mode of the data. 2/3
Example 4-2a Mode is the number appearing most often Use list from median to find mode With a visual inspection, notice there are many 0’s and 2’s Count how many of each 0, 0, 0, 0, 0, 0, 1, 1, 1, 2, 2, 2, 2, 2, 3, 3, 3, 4, 4, 4, 6, 6, 10, 11, 12 5 6 Mode = 0 Note: If no number is listed more than once then the mode would be “none” Answer: mean = 3.06; median = 2; mode = 0 2/3
Pets 0 2 1 0 1 3 5 2 0 1 0 2 3 1 2 0 Example 4-2b PETSThe table below shows the number of pets students in an art class at Green Hills Middle School have at home. Find the mean, median, and mode of the data. Answer: mean = 1.44; median = 1; mode = 0 2/3
Example 4-3a FIRST FAMILIESThe line plot in the bottom margin shows the number of children of United States presidents. Would the mean, median, or mode best represent the number of children? Must find the mean, median, and mode to know which would best represent the number of children 3/3
Example 4-3a Add the data in each column Multiply the number by how many “x”’s Count total pieces of data and put in denominator 0(7)+ 1(5)+ 2(11)+ 3(4)+ 7(2)+ 8(1)+ 10(1) 4(6)+ 5(6)+ 6(3)+ Mean = 46 3/3
Example 4-3a Follow Order of Operations Rules P E MD AS Must do operations in numerator before using denominator Do all multiplication first Bring down the denominator 0(7)+ 1(5)+ 2(11)+ 3(4)+ 7(2)+ 8(1)+ 10(1) 4(6)+ 5(6)+ 6(3)+ Mean = 46 10 0 + 5 + 22 + 12 + 24 + 30 + 18 + 8 + 14 + Mean = 46 3/3
Example 4-3a Follow Order of Operations Rules P E MD AS Add all numbers together in numerator Bring down the denominator Divide 0 + 5 + 22 + 12 + 24 + 30 + 18 + 14 + 8 + 10 Mean = 46 143 Mean = 46 Mean = 3.11 3/3
Example 4-3a FIRST FAMILIESThe line plot in the bottom margin shows the number of children of United States presidents. Would the mean, median, or mode best represent the number of children? Must find the mean, median, and mode to know which would best represent the number of children 3/3
Example 4-3a Order numbers from least to greatest There are 7 zeros so must list it 7 times Do each of the other numbers the same way 0, 0, 0, 0, 0, 0, 0, 1, 1, 1, 1, 1, 0, 0, 0, 0, 0, 0, 0, 1, 1, 1, 1, 1, 2, 2, 2, 2, 2, 2, 2, 2, 2, 2, 2, 0, 0, 0, 0, 0, 0, 0, 3, 3, 3, 3, 4, 4, 4, 4, 4, 4, 5, 5, 5, 5, 5, 5, 6, 6, 6, 7, 7, 3, 3, 4, 4, 4, 4, 4, 4, 5, 5, 5, 5, 5, 5, 6, 6, 6, 7, 7, 8, 3, 3, 4, 4, 4, 4, 4, 4, 5, 5, 5, 5, 5, 5, 6, 6, 6, 7, 7, 8, 10 3, 3, 3, 3, 4, 4, 4, 4, 4, 4, 3, 3, 4, 4, 4, 4, 4, 4, 5, 5, 5, 5, 5, 5, 3, 3, 4, 4, 4, 4, 4, 4, 5, 5, 5, 5, 5, 5, 6, 6, 6, 3/3
Example 4-3a Remember, when we found the mean there were 46 pieces of data so divide 46 by 2 which is 23 Underline the first 23 numbers Underline the last 23 numbers 0, 0, 0, 0, 0, 0, 0, 1, 1, 1, 1, 1, 2, 2, 2, 2, 2, 2, 2, 2, 2, 2, 2, 3, 3, 3, 3, 4, 4, 4, 4, 4, 4, 5, 5, 5, 5, 5, 5, 6, 6, 6, 7, 7, 8, 10 Note: There are no numbers left no underlined so find the mean of the two numbers in the middle 2 + 3 Median = 2.5 Median = 2 3/3
Example 4-3a FIRST FAMILIESThe line plot in the bottom margin shows the number of children of United States presidents. Would the mean, median, or mode best represent the number of children? Must find the mean, median, and mode to know which would best represent the number of children 3/3
Example 4-3a With a number plot, just look at the plot and find which number(s) have the most x’s Mode = 2 3/3
Example 4-3a FIRST FAMILIESThe line plot in the bottom margin shows the number of children of United States presidents. Would the mean, median, or mode best represent the number of children? Mean = 3.11 If there are no outliers, the mean is usually the best representation Median = 2.5 Mode = 2 In this case the median is very close to the mean and there are no outliers Answer: The mean and median are very close together so they both could best represent the number of children of US presidents 3/3
Example 4-3b * SIBLINGSThe line plot below shows the number of siblings of each student in a particular classroom. Would the mean, median, or mode best represent the number of siblings? Answer: The mean, median, and mode are close with values of 1.56 (without the outlier), 2, and 2 respectively. The median or mode would be best representative of the data 3/3
End of Lesson 4 Assignment