Download
1 / 32
340 likes | 416 Vues
Explore the dynamics of unemployment and inflation, their costs, and trade-offs in the economy. Learn about Okun's Law, Phillips Curve, and impacts on individuals and society.

E N D
Chapter 12 Unemployment and Inflation Abel and Bernake
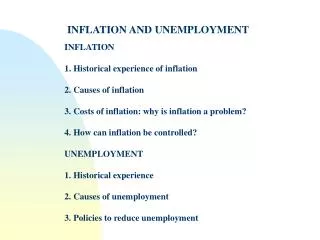
Chapter Outline Unemployment and Inflation: Is There a Trade-Off? The Problem of Unemployment The Problem of Inflation
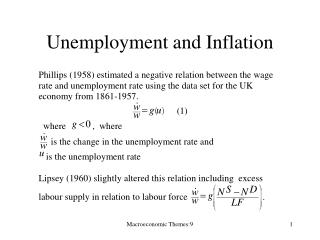
Fig 12.1The Phillips curve and the U.S. economy during the 1960s Source: Federal Reserve Bank of St. Louis FRED database at research.stlouisfed.org/fred2, series CPIAUCSL and UNRATE.
Fig 12.2Inflation and unemployment in the United States Source: Federal Reserve Bank of St. Louis FRED database at research.stlouisfed.org/fred2, series CPIAUCSL and UNRATE.
Fig 12.4Unanticipated inflation in the extended classical model
The expectations-augmented Phillips curve The expectations-augmented Phillips curve: (12.1) (-e): unanticipated inflation (u - ): cyclical unemployment When e, u When e, u When e, u
Fig 12.5 The shifting Phillips curve: Friedman-Phelps Theory(1). An increase in expected inflation
Fig 12.6 The shifting Phillips curve: (2) An increase in natural unemployment rate
Fig 12.7The expectations-augmented Phillips curve in the United States Source: Federal Reserve Bank of St. Louis FRED database at research.stlouisfed.org/fred2, series CPIAUCSL (inflation) and UNRATE (unemployment rate); expected inflation: Federal Reserve Bank of Philadelphia Livingston Survey at www.philadelphiafed.org; natural rate of unemployment: Congressional Budget Office, www.cbo.gov/ftpdocs/100xx/doc10014/Mar09Web_ Tbl_potential.xls.
長期、短期菲利浦曲線(Phillips Curve)伏克爾法則 凱恩斯:一點通貨膨脹是好事,刺激經濟,降低失業。 ---短期菲利浦曲線(trade-off between inflation and unem ) 理性預期學派:當人們已經習慣了的時候,這種方法就無效了。 ---長期菲利浦曲線 貨幣主義(Monetarism)Friedman傅利德曼: 降低通貨膨脹率的唯一方法是收緊銀根, 而這必然引起暫時的衰退。 Volcker伏克爾遵循,卡特不願支持這項嚴厲的措施。 雷根支持Volcker減少貨幣供給,經濟開始減速和緊縮。 失業率達到了10%。利率高達20%,高利率吞噬了利潤。 改革持續了三年-公眾的憤怒情緒不斷增強。 直到1982年,通貨膨脹被消滅了。PC做圖? 13
The Problem of Unemployment The costs of unemployment Loss in output from idle resources Workers lose income Society pays for unemployment benefits and loses tax revenue Okun’s Law
The costs of unemployment Personal or psychological cost to workers and their families Especially important for those with long spells of unemployment There are some offsetting factors Unemployment leads to increased job search and acquiring new skills, which may lead to increased future output Unemployed workers have increased leisure time, though most wouldn’t feel that the increased leisure compensated them for being unemployed
The changing natural rate of unemployment How to calculate the natural rate of unemployment?
Fig 12.9 Actual and natural unemployment rates in the United States, 1960–2008 Sources: Actual unemployment rate, Federal Reserve Bank of St. Louis FRED database at research.stlouisfed.org/fred2, series UNRATE; natural rate of unemployment: Congressional Budget Office, www.cbo.gov/ftpdocs/100xx/doc10014/Mar09Web_Tbl_potential.xls.
The Problem of Inflation The costs of inflation Perfectly anticipated inflation No effects if all prices and wages keep up with inflation Even returns on assets may rise exactly with inflation Shoe-leather costs: People spend resources to economize on currency holdings; the estimated cost of 10% inflation is 0.3% of GNP Menu costs: the costs of changing prices
The costs of inflation Unanticipated inflation ( – e) Realized real returns differ from expected real returns Expected ri – e Actual ri – Actual r differs from expected r by e – Numerical example: i 6%, e 4%, so expected r 2%; if 6%, actual r 0%;if 2%, actual r 4%
The costs of inflation Unanticipated inflation ( – e) Result: transfer of wealth From lenders to borrowers when e From borrowers to lenders when e Similar effect on wages and salaries Loss of valuable signals provided by prices Confusion over changes in aggregate prices vs. changes in relative prices So people want to avoid risk of unanticipated inflation They spend resources to forecast inflation
Indexed contracts People could use indexed contracts to avoid the risk of transferring wealth because of unanticipated inflation Most U.S. financial contracts are not indexed, with the exception of some long-term contracts like adjustable-rate mortgages and inflation-indexed bonds issued by the U.S. Treasury beginning in 1997 Many U.S. labor contracts are indexed by COLAs (cost-of-living adjustments) Indexed contracts are more prevalent in countries with high inflation
The costs of hyperinflation Hyperinflation 惡性通貨膨脹 is a very high, sustained inflation (for example, 50% or more per month) Hungary in August 1945 had inflation of 19,800% per month Bolivia had annual rates of inflation of 1281% in 1984, 11,750% in 1985, 276% in 1986
The costs of hyperinflation There are large shoe-leather costs, as people minimize cash balances People spend many resources getting rid of money as fast as possible Tax collections fall, as people pay taxes with money whose value has declined sharply Prices become worthless as signals, so markets become inefficient
Fighting inflation: The role of inflationary expectations If rapid money growth causes inflation, why do CB allow the money supply to grow rapidly? Developing or war-torn countries may not be able to raise taxes or borrow, so they print money to finance spending Industrialized countries may try to use expansionary monetary policy to fight recessions, then not tighten monetary policy enough later
Fighting inflation: The role of inflationary expectations Disinflation is a reduction in the rate of inflation But disinflations may lead to recessions An unexpected reduction in inflation leads to a rise in unemployment along the Phillips curve The costs of disinflation could be reduced if expected inflation fell at the same time actual inflation fell
Fighting inflation: The role of inflationary expectations Rapid versus gradual disinflation The classical prescription for disinflation is cold turkey —a rapid and decisive reduction in money growth Proponents argue that the economy will adjust fairly quickly, with low costs of adjustment, if the policy is announced well in advance Keynesians disagree with rapid disinflation Price stickiness due to menu costs and wage stickiness due to labor contracts make adjustment slow Cold turkey disinflation would cause a major recession if the costs of the policy are high (recession), the government will reverse the policy The Keynesian prescription for disinflation is gradualism
The sacrifice ratio When unanticipated tight monetary and fiscal policies are used to reduce inflation, they reduce output and employment for a time, a cost that must be weighed against the benefits of lower inflation Economists use the sacrifice ratio as a measure of the costs Sacrifice ratio is the number of percentage points of output lost in reducing inflation by one percentage point Ball’s study: U.S. inflation fell by 8.83 % in the early 1980s, with a loss in output of 16.18% of the nation’s potential output Sacrifice ratio = 16.18/8.83 = 1.832
The sacrifice ratio Ball studied the sacrifice ratios for many different disinflations around the world in the 1960s, 1970s, and 1980s The sacrifice ratios varied substantially across countries, from less than 1 to almost 3 One factor affecting the sacrifice ratio is the flexibility of the labor market Countries with slow wage adjustment have higher sacrifice ratios Ball also found a lower sacrifice ratio from cold turkey disinflation than from gradualism Ball’s results should be interpreted with caution, since it isn’t easy to calculate the loss of output and because supply shocks can distort the calculation of the sacrifice ratio
Wage and price controls Pro: Controls would hold down inflation, thus lowering expected inflation and reducing the costs of disinflation Con: Controls lead to shortages and inefficiency; once controls are lifted, prices will rise again The Nixon wage-price controls from 1971/8 to 1974/4 led to shortages in many products; the controls reduced inflation when they were in effect, but prices returned to where they would have been soon after the controls were lifted
Wage and price controls The outcome of wage and price controls may depend on what happens with fiscal and monetary policy If policies remain expansionary, people will expect renewed inflation when the controls are lifted If tight policies are pursued, expected inflation may decline
Credibility and reputation Key determinant of the costs of disinflation: how quickly expected inflation adjusts This depends on credibility of disinflation policy: if people believe the government and if the government carries through with its policy, expected inflation should drop rapidly Credibility can be enhanced if the government gets a reputation for carrying out its promises Also, having a strong and independent central bank that is committed to low inflation provides credibility
The U.S. disinflation of the 1980s and 1990s Fed chairmen Volcker and Greenspan gradually reduced inflation rate in the 1980s and 1990s They sought to eliminate inflation as a source of economic instability They wanted people to be confident that inflation would never be very high again Inflation expectations were erratic before 1990 Inflation expectations were slow to decline initially (in the late 1970s and early 1980s) because Volcker and the Fed lacked credibility But as inflation continued to fall, the Fed’s credibility increased, and inflation expectations declined gradually Inflation expectations fell gradually from 1990 to 1998 and have been stable since then
Fig 12.10 Expected inflation rate 1971–2009 Sources: Survey of Professional Forecasters, Federal Reserve Bank of Philadelphia, available at www.philadelphiafed.org.