Download
1 / 6
60 likes | 80 Vues
Explore cancer mortality rates, spending, and disease burden statistics in the U.S. based on data from reputable sources. Understand the impact of cancer on health services expenditure and the growth trend over a 12-year period.

E N D
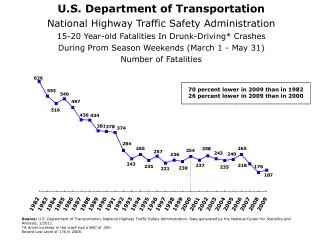
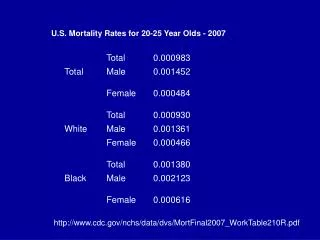
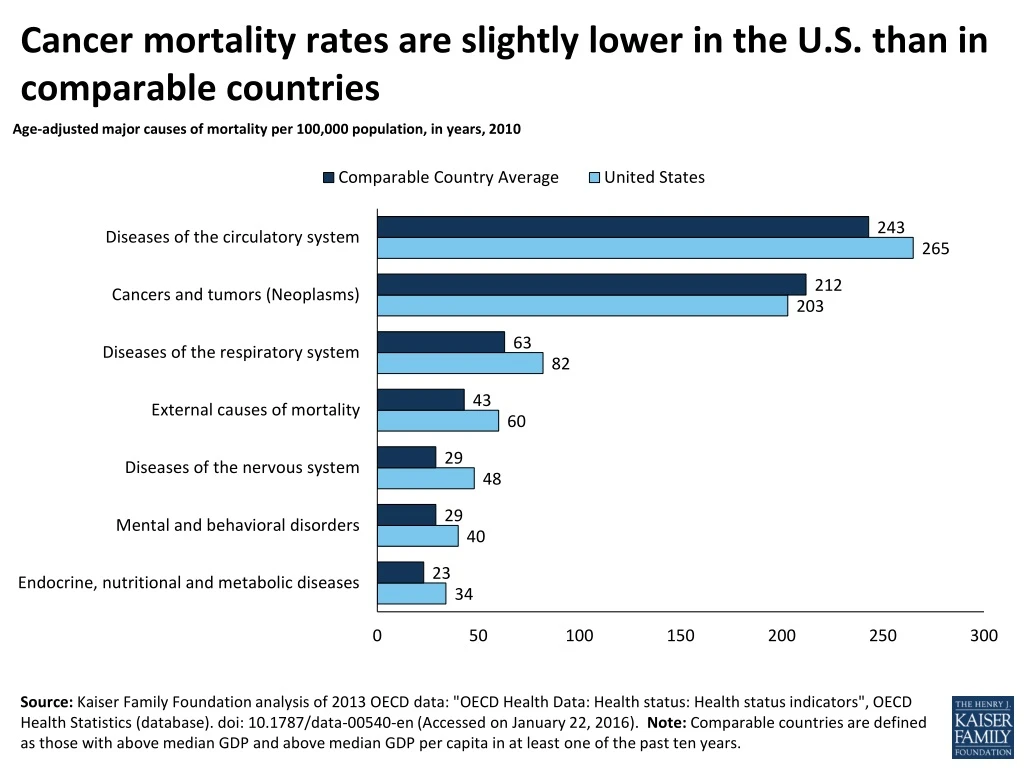
Cancer mortality rates are slightly lower in the U.S. than in comparable countries Age-adjusted major causes of mortality per 100,000 population, in years, 2010 Source: Kaiser Family Foundation analysis of 2013 OECD data: "OECD Health Data: Health status: Health status indicators", OECD Health Statistics (database). doi: 10.1787/data-00540-en (Accessed on January 22, 2016). Note: Comparable countries are defined as those with above median GDP and above median GDP per capita in at least one of the past ten years.
Lung cancer is the largest contributor to diseaseburden among cancers for both males and females MALES Age standardized disability adjusted life years (DALYs) rate per 100,000 population, males in the U.S., 2013 FEMALES Age standardized disability adjusted life years (DALYs) rate per 100,000 population, females in the U.S., 2013 Source: Institute for Health Metrics and Evaluation. Global Burden of Disease Study Data Downloads, available here: http://ghdx.healthdata.org/global-burden-disease-study-2013-gbd-2013-data-downloads (Accessed May 11, 2016)
Cancer spending accounts for about 7% of disease-based health expenditures Total expenditures in US $ billions by disease category, 2012 Source: Bureau of Economic Analysis Health Care Satellite Account (Blended Account) and National Health Expenditure Data Note: Spending on dental services, nursing homes, and prescriptions that cannot be allocated to a specific disease not included above. Data last updated January 25, 2016.
While Cancer is one of the top contributors to disease burden, it was not a leading driver of medical services spending growth from 2000-2012 Contribution to medical services expenditure growth, by disease, 2000-2012 Source: Kaiser Family Foundation analysis of Bureau of Economic Analysis Health Care Satellite Account (Blended Account) Note: Expenditures on nursing home and dental care are not included in health services spending by disease. Data last updated January 25, 2016.
Average growth in per capita spending for cancer was slightly lower than the average for all disease categories Average annual growth in expenditures by disease category (per capita), price index by disease category (cost to treat each case), and real expenditures by disease category (number of treated cases), 2000 - 2012 Source: Kaiser Family Foundation analysis of Bureau of Economic Analysis Health Care Satellite Account (Blended Account) Note: Expenditures on nursing home and dental care are not included in health services spending by disease. Data last updated January 25, 2016.
Cancer medications were among the top 3 conditions for specialty drug spending in 2015 Express Scripts per-member-per-year spending, top 10 specialty therapy class drugs, 2015 Source: Express Scripts 2015 Drug Trend Report