Mortality Rates
Mortality Rates. LEARNING OBJECTIVES TO DEFINE THE DIFFERENT MEASUREMENTS OF MORTALITY TO IDENTIFY THE DIFFERENT GLOBAL MORTALITY TRENDS. Measuring Mortality. Crude Death Rate : The average annual number of deaths during a year per 1,000 population. Problems with CDR.


Mortality Rates
E N D
Presentation Transcript
Mortality Rates LEARNING OBJECTIVES TO DEFINE THE DIFFERENT MEASUREMENTS OF MORTALITY TO IDENTIFY THE DIFFERENT GLOBAL MORTALITY TRENDS
Measuring Mortality • Crude Death Rate: The average annual number of deaths during a year per 1,000 population.
Problems with CDR • The problem with using CDR (Crude Death Rates) is it affected by the age structure of the country. • If all other things are equal CDR goes up as the average age of the population goes up.
Measuring Mortality • Life ExpectancyThe average number of years to be lived by a group of people born in the same year, if mortality at each age remains constant in the future.
Issues with Life Expectancy • It is an AVERAGE. • You can split the total population into different groups (cohorts) to compare some of these differences within a population. • Rich v poor, urban v rural, male v female, ethnic groups, age groups. • Life expectancy figures can be affected by high IMR. If you survive infancy you could live much longer than the life expectancy figures suggest.
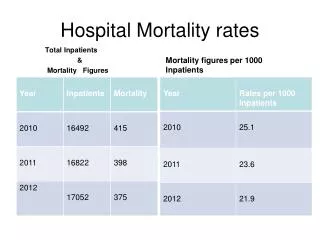
Measuring Mortality • Age Sex Specific Death Rate • The death rate for a particular age group within the population (male/female) • Most common… • INFANT MORTALITY (First year of life) • CHILD MORTALITY (First 5 years)
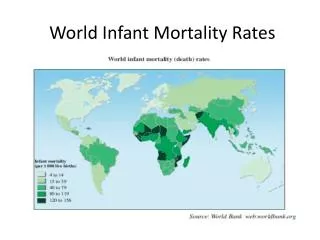
Infant Mortality • Many deaths in this age group are preventable and therefore IMR decreases dramatically as medical care is improved. • For this reason IMR is seen as an accurate indicator of development.
Infant Mortality • Status of women and income • Educational level of mother • Age of mother • Also birth interval
Mortality trends • MEDCs main decrease in late industrial revolution. • In 1870 life expectancy Manchester - 29 years Sheffield – 33 years
Mortality trends • LEDCs main decreases in second half of twentieth century
Mortality Trends • HIV Aids has had a huge impact on populations.
Mortality Trends • SARS, Asian Bird Flu, Swine Flu, other future pandemics?
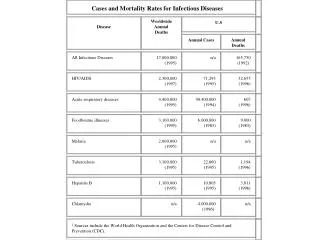
“malaria remains the biggest cause of death for children under five in Africa.” Jong-Wook Lee, 2006 CHOLERA
A high incidence of infectious diseases such as HIV/Aids, cholera, malaria and typhoid will result in low life expectancy and high infant and child mortality rates. Poor sanitation and water supply. Explaining life expectancy patterns Poor health care systems mean that societies are not in a position to combat and fight against diseases that are often manageable and preventable. High levels of malnutrition contribute significantly and make it difficult for people to fight disease.
Epidemiological Transition Model LEDC ____________________________________ MEDC Infectious diseases ____________ Degenerative diseases Cholera, TB, Aids, Diarrhoea, Malaria, Typhoid Cancer, Heart disease