Download
1 / 31
380 likes | 762 Vues
This comprehensive guide explores different mortality measures, their significance, and the limitations associated with mortality rate data. Learn about crude death rates, category-specific mortality rates, and age-specific mortality rates.

E N D
Measurement of Mortality Rates A.Prof. Dr. Maha A. AL-Nuaimi Ph.D. Com.Med.
Objectives • Identify the Types and characteristics of Mortality measures. • understand the usage and importance of each of these mortality measures. • Explain some of the problems related to the completeness and quality of the data
Mortality Rates Mortality is a term describes death and related issues. • Its usefulness? • Sources of data ??? Limitations: • Sources are limited. • Some deaths occur outside the hospitals. • Some deaths have unknown etiology. • Some certificates are not correctly noted.
TYPES OF MORTALITY MEASURES Levels of Mortality Rates are: • Crude rates • Specific rates/ratios • Adjusted rates
Crude Death Rate • It is the total number of deaths in a population divided by the total number of that population (midyear population-MYP-). • It includes?? • It measures the general health of the community. • Not gives idea about the age, sex or cause of death. • In the rates we use the mid year pop. (1/7), why? • CDR = all deaths / MYP X K • It is not helpful in comparison between communities.
AT 1999, Global CDR in Europe was 11/1000 pop, while in Asia was 8/1000 pop? Which is better? Comparison of the national crude death rates reveals that the rates displayed are higher in the developed countries, than in the less developed countries. Why ?
Crude Death Rate Advantage; • It represents the actual experience of the population. • Provides data useful for public health planning and administration. • Used for general international comparison. • Easy to use & calculate. • Use midyear pop. (approximates the average pop). Disadvantage; • CDR giving a general picture of mortality and not the accurate estimation because of the effect of age, sex and other confounding factors on the mortality). • Observed pop. differences are confounded with differences in the pop. structures.
CHARECTERISTICS OF CDR • Risks of death change by age, so CDR is affected by population age structure • Aging populations can have rising CDRs, even as the health conditions are improving • LDCs with very young populations will often have lower CDRs than MDCs even though their overall health conditions are poorer • Therefore mortality comparisons across countries should always use mortality indicators that are adjusted for differences in age composition
Category specific mortality rates • cause specific MRs • age specific MRs • sex specific MRs • race, religion, income……. • Category Specific Death Rate: CSDR = No. of deaths of specific category X 1000 No. of pop. of that category. at that yr. Is the most informative mort. Rates.
Category specific mortality rates Advantage; • Category specific rates are unconfounded by that factor. • Provide the most detailed and accurate information about the pattern of the disease in the pop. • It is a good indicator to measure incidence for diseases with high mortality, or sex or age race of high mortality (i.e. of short survival) (group at risk). • Useful in listing the 10 leading causes of death in a pop. • Useful to compare events between 2 populations. Disadvantage; • Long list of figures with 2 or 3 pop. (the comparison is difficult because of large no. & rates). • Crude rate = ∑( category sp. rate x prop. of pop. in category)
Age Specific Mortality Rate • ASMR=Number of people who died in a particular age group/Total population of the same age group during the same year X 1000. Why Age Specific Death Rates? • Can compare mortality at different ages • Can compare mortality in the same age groups over time and/or between countries and areas • Can be used to calculate life tables to create an age-independent measure of mortality (life-expectancy) Sex specific mortality rate • SSMR= No. of deaths in specific sex group/ total pop. Of the same sex group during the same period of time X 1000
Stillbirth Rate: - Is the spontaneous intrauterine death occur after 28 wk gestation/ total no. of live and died births X 1000. - it express as rate per 1000 live and died births pertain to a calendar year. • Neonatal mortality rate - NMR = [deaths in the 1st 28 days of life / total live births] X1000 - It reflects events happening after birth, primarily: • Congenital malformation • Prematurity • Low birth weight(birth wt less than 2500g.
POST NeoNATAL MORTALITY RATE = [deaths of infants between 28 days to the end of 1st yr / total live births] X 1000. - Postneonatal mortality rate: reflects env. Events, infectious dis. Nutritional level
Perinatal mortality late fatal deaths (stillbirth) + Infant death rate within 7 days at a given yr/ total live and died births of that yr X 1000 # of perinatal deaths / total # of births (still births + live births)) x 1000 • It reflects variation in the care of the mothers , their health, and nutritional status during pregnancy, delivery and after birth, also it a quality metric for obstetrics and pediatrics. • Approximately 3 million stillbirths and 3 million early infant deaths(during the 1st 7 days of life) occur across the globe/yr. • The perinatal mortality rate is 5 times higher in developing than developed regions: 10deaths/1000births in developed, 60/1000 in developing
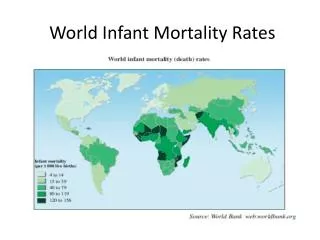
Infant Mortality Rate • IMR is a special age specific death rate No of infants dying during 1 year x1000 No of live births during the same period • IMR is an important indicator of the general health conditions of a pop. Quality of life indicators are: • IMR • Literacy rate • GNP
Why Infant Mortality Rates ? • The IMR is a good indicator of the overall health status of a population • It is a major determinant of life expectancy at birth • The IMR is sensitive to levels and changes in socio-economic conditions of a population. High rates indicates the unmet needs and poor Env. Conditions. • IMR used for international comparisons .
In 2007, • The lowest IMR is in Sweden of 2/1000 • Afghanstan reported a IMR of 165/1000, which is very high (least developing)
Maternal Mortality • Definition: • ‘Maternal death’ is death of a woman • while pregnant ,or • within 42 days of termination of pregnancy • Irrespective of the duration or site of the pregnancy • From any cause related to, or aggravated by the pregnancy or its management • Not from accidental causes The maternal mortality rate is the no. of maternal deaths ascribed to child births.
Maternal Mortality Ratio • Number of women who die as a result of complications of pregnancy or delivery in a given year per 100,000 live births in that year. # of maternal deaths = ----------------------------- ×100 ,000 # of total births Represents the risk associated with each pregnancy, i.e., the obstetric risk
Maternal Mortality Rate • Number of women who die as a result of complications of pregnancy or childbearing in a given year per 100,000 women of childbearing age in the population # of maternal deaths = -------------------------------------x1000 # of women ages 15 – 49 Represents both the obstetric risk and the frequency with which women are exposed to this risk
PROPORTIONAL MORTALITY: • It is proportion expressed as a percentage. No. of deaths from a specific Diseasein a given year Proportional = ــــــــــــــــــــــــــــــــــــــــــــــــــــــــــــــــــــــــــــــــــــــــــــ x 100 MortalityTotal no. of deaths in that year Note that ; • The numerator is part of denominator but It is not a real rate. Why?? • Does it tell much about the disease risk ? • to know the risk of specific disease, use?
Proportional Mortality • It is useful to know what proportion of total deaths are due to a particular cause (e.g., cancer). • what proportion of deaths are occurring in a particular age group (e.g., above the age of 50 years). • It expresses the “ # of deaths due to a particular cause (or in a specific age gp.) per 100 (or 1000) total deaths.”
Examples of Proportional Mortality rates • Proportional mortality from a specific disease = # of deaths from a specific disease in a year X100 total deaths from all causes in that year b) Under – 5 proportionate mortality rate= # of deaths under 5 years of age in the given year x 100 total # of deaths during the same period • Proportional mortality rate for aged 50 yrs & above = # of deaths of persons aged 50 yrs & above x 100 total deaths of all age groups in that year Note That: CFR and PMR are expressed as a percentage.
Proportional Mortality • It merely indicates the relative importance of a specific cause of death within a pop. In relation to all cause of death. • For health administrator , such information may be useful to determine priorities to planning. • The epidemiologist should study. Why such rate of dis. is higher in area A than area B. LIKE ?? • To be more useful, PMR must be combined with the cause specific rate.
Case Fatality Rate . It is % of people diagnosed with the disease dying in a certain time after diagnosis. • Mainly used in Acute diseases (epidemic properties). • In chronic dis. .. Problem of time . It is a measure of disease severity (virulence or killing power) not morbidity. . Can measure effectiveness of a new treatment. Expressed in % (PM, CFR) CFR = Total # of deaths due to a particular disease X 100 Total # of cases due to the same disease. • Denominator NOT whole pop. • It is ratio of deaths to cases. • The CFR for the same disease may vary in different epidemics because of changes in the agent, host & environmental factors • eg. Tetanus has CFR of 30% - 90% depending on???
Adjusted( standardized) rates: • Adjustment (Standardization) a process used to control such a confounding in which deaths, sub & grand totals and hence deaths are adjusted (standardized) • It is a statistically constructed single summary rate for each pop that takes in consideration any differences in the structure of pop with respect to certain variables. Advantage; • It is the gold standard method of comparisons between pops • It is a single no. Disadvantage; it is statistically constructed (not a real rate), So the remaining differences cannot be attributed to the effect of that variable.
Adjusted( standardized) rates: • In this type of rates we should have a certain standard pop. (reference pop) & compare the 2 pop. with it. • reference population is an external population used to help adjust or standardize the rate in the study population. This Reference pop. could be; • Any one of these 2 pop. • An outside pop. (we bring another pop. to compare with). • Mix the 2 pop. to produce a new one.
3. Adjusted( standardized) rates: • Standardization could be: a. Direct standardization: The multiplication of the category specific rate in each pop by the weights taken from standardized pop. b. Indirect standardization : The multiplication of the category specific rate from the standard pop by the weights from the pop need to be compared. The results is called the expected no. this is presented as SMR (standardized mortality ratio) Observed death "O" SMR = ــــــــــــــــــــــــــــــــــــــــــــــــــــــــــــ x 100 Expected death "E"