Understanding Measurement Error in Mortality Models: Implications and Solutions
220 likes | 343 Vues
This study addresses the impact of measurement error on mortality models, particularly regarding competition variables that influence predictions. It highlights that ignoring measurement error can lead to biased parameter estimates and loss of power during model fitting. We explore various solutions, including Regression Calibration and Bayesian methods, to correct for these errors, ensuring more accurate predictions across different populations. Using data from the USDA Forest Service, we present evidence of the significant effects measurement error can have on regression outcomes and the importance of proper model fitting.

Understanding Measurement Error in Mortality Models: Implications and Solutions
E N D
Presentation Transcript
Measurement error in mortality models Clara Antón Fernández Robert E. Froese School of Forest Resources and Environmental Science. Michigan Technological University 1400 Townsend Drive. Houghton, Michigan 49931
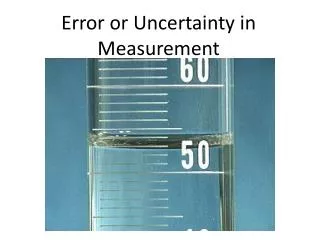
The problem • Competition variables are measured with error
The problem • Min 45 • Max 109 • Mean 70 • “real” 61 • Measured 65.4
The problem • Prediction of a response versus inference for parameters • Generally, there is no need for the modeling of measurement error to play a role in the prediction problem • The unique situation when we need to correctly model the measurement error occurs when we develop a prediction model using data from one population but we wish to predict in another population.
The problem • Sampling error variances change during the simulation. • They depend on • sample plot sizes (fixed at the beginning of the simulation but may be differ from the one used for fitting the model) • spatial structure of the stand (tree size and spacing)
PREDICTION DURING MODEL FITTING LOSS OF POWER for detecting relationships among variables The cost • If we ignore the changes in the error structure of the competition variables BIASED
The cost TRUE OBSERVED Source: Carroll, R. J., D. Ruppert, L. A. Stefanski, and C. M. Crainiceanu. 2006. Measurement error in nonlinear models. Chapman and Hall/CRC.
Solutions: Linear case • Attenuation: The effect of measurement error is, generally, to bias the slope estimate towards zero. • Stage and Wykoff (1998) proposed the Structural Based Prediction (SBP) procedure • Results: considerable change in the magnitude of some regression coefficients and an increase in residual variance
The non-linear case • The effects of measurement error are more complex • The bias could be under or over-estimated, even for the variables that are measured without error.
The non-linear case • Regression Calibration • SIMEX • Score function methods • Likelihood and quasilikelihood • Bayesian methods Simple Generally applicable Once the replacement is made, essentially the same methods for ongoing analyses can be employed as if X was observed Computationally more intensive that RC Result in fully consistent estimators more generally Computationally more demanding Require strong distributional assumptions
Regression Calibration • “Widely used, effective (and) reasonably well investigated” (Pierce and Kellerer, 2004) • Basis: replacement of X by the regression of X on (Z,W). X variables measured with error, Z variables measured without error, W observation related with X • Once the replacement is made, essentially the same methods for ongoing analyses can be employed as if X was observed.
Data • USDA Forest Service Region 1 Permanent Plot Program • The set includes • regenerating stands in the Rocky Mountain Region • control and treated (managed) stands • 34,243 tree measurements • 189 stands
Results and consequences BEFORE AFTER RC PBAL frequency distribution for western hemlock
Results and consequences Western hemlock Figure 4. Western larch (top) and western hemlock (bottom) sensitivity graphs.
Results and consequences Lodgepole pine
Results and consequences • Contrary to the linear case, the effect of the sampling error in the multivariate logistic case can be under- or overestimate the effect of the variable, even for variables that are measured without errors • Results might be influenced by the limited scope of the data
Summary Measurement error in mortality models • Measurement error can cause • Loss of power in the fitting phase • Bias in the prediction phase • Regression Calibration corrects for measurement error before models are fitted or applied • The effect of the sampling error in the multivariate logistic case can be under- or overestimate the effect of the variable, even for variables that are measured without errors