Download
1 / 5
50 likes | 273 Vues
Fig.1. d b a. Fluorescence emission spectra of (a) DLE (5.00 M ), (b) DLE/BSA (5.00 M /2.50 M ) and (c-D)DLE/BSA/Hg 2+ with different concentrations of Hg 2+ from 5 M to 30 M in 50mM NaAC solution. Inset shows

E N D
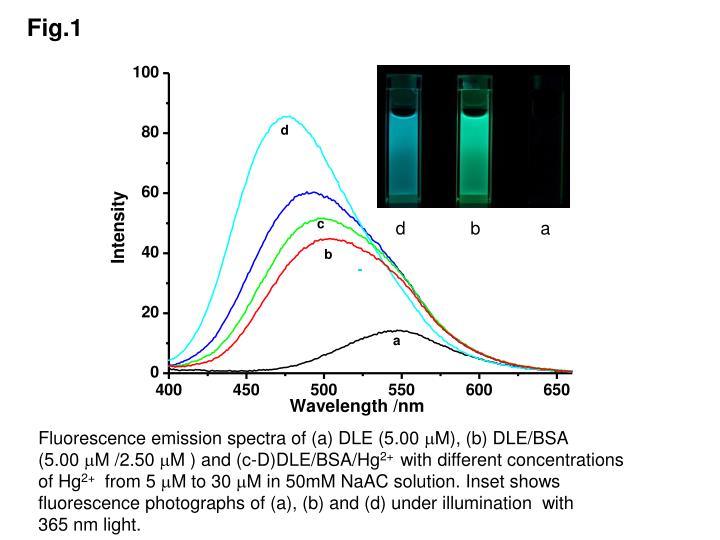
Fig.1 d b a Fluorescence emission spectra of (a) DLE (5.00 M), (b) DLE/BSA (5.00 M /2.50 M ) and (c-D)DLE/BSA/Hg2+ with different concentrations of Hg2+ from 5 M to 30 M in 50mM NaAC solution. Inset shows fluorescence photographs of (a), (b) and (d) under illumination with 365 nm light.
Fig.2 g b a Fluorescence emission spectra of (a) DLS (5.00 M), (b) DLS/BSA (5.00 M /2.50 M ) and (c-g)DLS/BSA/Hg2+ with different concentrations of Hg2+ from 5 M to 200 M in 50 mM NaAC solution. Inset shows fluorescence photographs of (a), (b) and (g) under illumination with 365 nm light.
Fig.3 b a h Fluorescence emission spectra of (a) DLP (5.00 M), (b) DLP/BSA (5.00 M /2.50 M ) and (c-h)DLP/BSA/Hg2+ with different concentrations of Hg2+ from 5 M to 200 M in 50 mM NaAC solution. Inset shows fluorescence photographs of (a), (b) and (h) under illumination with 365 nm light.
Fig.4 a j b Fluorescence emission spectra of (a) DLT(5.00 M), (b) DLT/BSA (5.00 M /2.50 M ) and (c-j)DLT/BSA/Hg2+ with different concentrations of Hg2+ from 5 M to 200 M in 50 mM NaAC solution. Inset shows fluorescence photographs of (a), (b) and (j) under illumination with 365 nm light.
Fig.5 DLE + Hg2+ 5µM 150µM (B) Estimation of binding constant of DLE (30 µM) with Hg2+ : the plot based on the 1:1 binding model :I0/(I-I0) versus [Hg2+]-1 (A) Fluorescence emission spectra of DLE(30 µM) upon addition of Hg2+ (from 5 to 150 µM) in 50.0 mM NaAC solution. The excitation length is 340 nm.