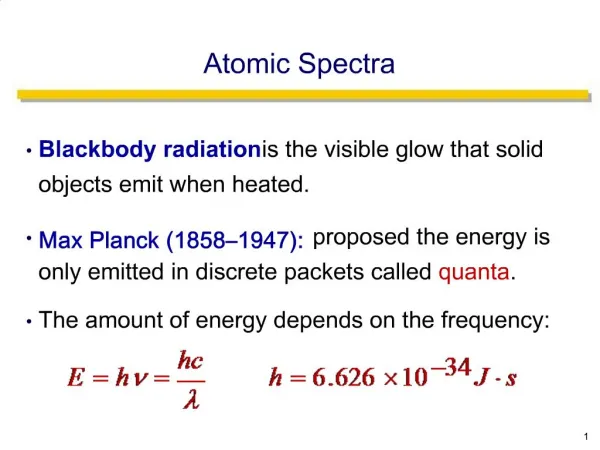
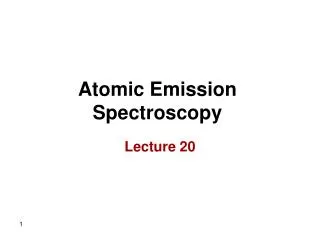
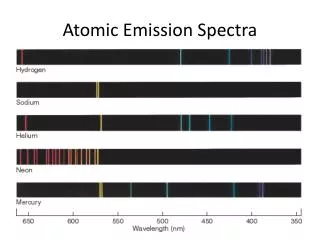
Atomic Emission Spectra
Atomic Emission Spectra. First Ionization Energies. IE Excel File. He. Ne. F. N. O. C. Be. B. Li. Successive Ionization Energies (kJ/ mol ). Photoelectron Spectroscopy. based on photoelectric effect monochromatic light shone on sample, causes e- to be emitted

Atomic Emission Spectra
E N D
Presentation Transcript
First Ionization Energies IE Excel File
He Ne F N O C Be B Li
Photoelectron Spectroscopy • based on photoelectric effect • monochromatic light shone on sample, causes e- to be emitted • kinetic energy of emitted e- measured • difference between the energy of photons used (h) and the kinetic energy (KE) of the ejected e- equals the energy needed to remove the e- IE = h - KE
Images from http://media.collegeboard.com/digitalServices/swf/ap-webcasts/chemistry/ap_chem_pes.html
Images from http://media.collegeboard.com/digitalServices/swf/ap-webcasts/chemistry/ap_chem_pes.html
Images from http://media.collegeboard.com/digitalServices/swf/ap-webcasts/chemistry/ap_chem_pes.html
Photoelectron Spectroscopy IE = h - KE
Photoelectric Spectrum of Lithium 6.26 0.52
Photoelectric Spectrum of Beryllium 11.5 0.90
Photoelectric Spectrum of Boron 1.36 19.3 0.80
Photoelectric Spectrum of Carbon 28.6 1.72 1.09
Given the complete PES spectrum below, identify the element and write its electron configuration. Two More Q’s