Download
1 / 48
480 likes | 626 Vues
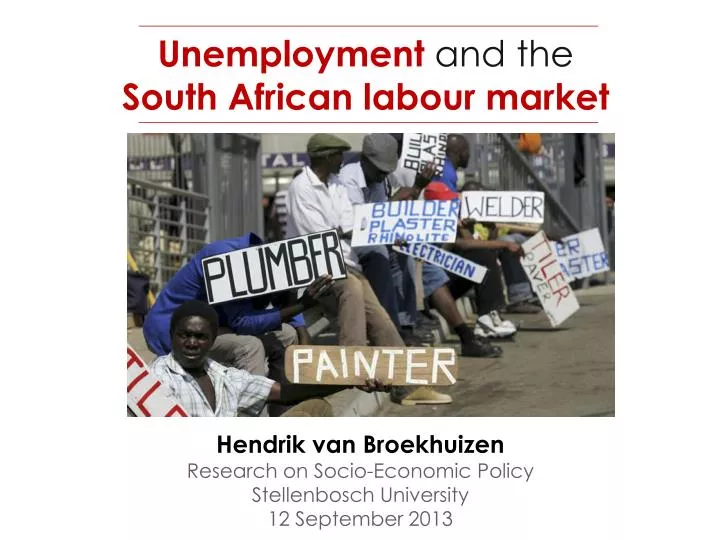
Unemployment and the South African labour market . Hendrik van Broekhuizen Research on Socio-Economic Policy Stellenbosch University 12 September 2013. Concepts, figures, and statistics in this presentation: Primary sources.

E N D
Unemployment andtheSouth African labour market Hendrik van Broekhuizen Research on Socio-Economic Policy Stellenbosch University 12 September 2013
Concepts, figures, and statistics in this presentation: Primarysources • CDE. (2011). A fresh look at unemployment: A conversation among experts. CDE Workshop Paper, Centre for Development and Enterprise • StatsSA. (2013). Quarterly Labour Force Survey: Quarter 1 Press Statement. Statistics South Africa. • CDE. (2013). Graduate unemployment in South Africa: A much exaggerated problem. CDE Insight. Johannesburg: Centre for Development and Enterprise. • CDE. (forthcoming). South Africa’s education crises. CDE Insight. Johannesburg: Centre for Development and Enterprise. • OECD. (2013). OECD Economic Surveys: South Africa 2013. OECD Publishing.
Why focus on unemployment? • Unemployment and employmentare measures of a country’s socio-economic health. • Global employment crisis following financial crisis • High and/or rising levels of unemployment are increasingly becoming • cause for concern • the target of policy interventions • The basis for political and ideological division
Figure – Peak-to-trough fall in output and employment (2007 – 2010)
Figure – Total employment in SA (2008 – 2013) 1 000 000 jobs lost 646 000 jobs gained
Why focus on SA labour market? • Engine of economic development • Vehicle of socio-economic change • For good or bad • Features and issues will propagate through entire economy
33 million Working-age Population 12.7 million NEA
33 million Working-age Population 12.7 million NEA 13.6 million Employed
33 million Working-age Population 12.7 million NEA 2.3 million Discouraged work seekers 13.6 million Employed
33 million Working-age Population 12.7 million NEA 4.6 million Unemployed 2.3 million Discouraged work seekers 13.6 million Employed
Who are the unemployed? 70.7% between 15 - 34 HELP 59.4% have less than matric 65.3% long term unemployed 44% new entrants 49.1% females
Figure – Official and expanded unemployment rate (2008 – 2013)
The scale of SA’s unemployment crisis I • Official unemployment rate underestimates crises • Excludes discouraged work-seekers • Employment rate may be more reflective
The scale of SA’s unemployment crisis II • Employment rate perhaps more reflective than official unemployment rate, but • Still includes underemployed • Even so, we are lagging behind internationally • To reach international norm of 60% ER • requires 6 million more jobs than the current 13.6 million • How do we create those jobs?
Employment and Growth I • Economic growth necessary condition for job creation, but not sufficient • Economic growth is not a sufficient condition for job creation • Employment coefficient
Employment and GrowthII • Why an employment coefficient of <0.4? • Decline related to many factors • Economic, legislative, regulatory pressures • Drive industries and employers toward less labour-intensive and more skill-intensive production • To reach international norm of 60% ER requires • 33 mill + 7% GDP↑ for 15 years • 1.9%↑ in 33 mil + 7% GDP↑ + >40 years • Growth alone, even when rapid and sustained, cannot be a solution to unemployment • How to increase labour intensity?
Drivers of economic growth in SA • Driven primarily by unsustainable ↑ Government spending since 2000 • Local markets small = reliance on exports • Employment growth requires labour-intensive exports and competitiveness • Detrimental factors • High cost of doing business, cost of labour, exchange rate (volatility) • High transport costs • Regulatory burden • No economies of scale
Employment, labour costs, and productivity • Employment = f(Labour Productivity, Labour Cost) • Labour cost • Wages and benefits (direct) • Training, other benefits, complying with regulatory requirements (indirect) • Risk → increases potential labour cost • ↑∑LC fewer job offers and jobs created • ∆Employment = f(LP/LC) • Employers have two responses to high labour costs: • Pass costs on to consumers • Employ fewer high-cost, low-productivity labourers
Figure – Average changes in productivity and real wages per decade, 1970 - 2009
Unions and collective bargaining • Empirical evidence • Unionised workers’ wages 10% - 20% > non-unionised • Firms covered by collective bargaining have ↑ wage rates ↓ employment • Only third of formal economy covered by centralised bargaining • Sectors concerned among most critical • Provide benchmark for wage ↑ in other sectors • Severs link between productivity and wages
TheCosts of dismissal • Cannot hire low-productivity cheaply, so don’t hire at all • Exacerbated by non-wage costs and risks associated with employment. • The more risky, the less likely to be employed • Young • Unskilled • Inexperienced • Costly and risky to dismiss employees
TheCosts of strikes • Labour regulation in SA perhaps on par internationally • Real crux is ‘militancy’ of SA trade unions • Raise the risk-adjusted wage and non-wage costs of employment • Strike action heavier in public than private sector (in general) • Knock-on effect i.t.o. services protests, disruptions, and further strikes
Figure – Number of working days lost due to industrial action (2005 – 2012)
TheCosts of strikesStrike action in 2012 – scale of militancy • 17.3 million working hours lost due to illegal or unprotected strikes • 99 strikes of which half illegal • 118 200 workers involved, 100 850 in the mining sector • Strikes often accompanied by violence and destruction of property
TheCosts of strikesStrike action in 2013 – implications of militancy • 3-week strike in automotive manufacturing sector • Gained: • Wage increases >>>> inflation • Lost: • 45 000 vehicles, R20bn in potential revenue • GDP, tax receipts, workers pay, employment numbers • Allure as FDI destination • SA motor industry = 30% of industrial output and just under 5% of GDP. • Strikes rob SA of business opportunities – i.e. employment opportunities
Therole of labour market reform • Little agreement on labour reforms between labour and industry • Need to identify reforms that will stimulate establishment of labour-intensive enterprises. • More medium and low-productivity firms with lower employment costs • SA’s ‘missing middle’ • Reforms are on the table, but…
Social grants and LFP • SA LFP rate low (54.8%) • Historically low among women and blacks • Does social welfare incentivise or disincentivise LFP? • Mixed empirical evidence in SA • Increase in access to social grants coincided with increase in LFP rates • Increases in LFP not commensurately met by increases in employment • Rising unemployment
Figure – Labour force participation rates in 25 countries (2008)
Figure – Social grants versus labour force participation rates (1996 - 2009)
Reservation wages • Reservation wages and LFP • Mixed evidence for SA • However, long job queues suggest not… • Expanded Public works Programme and labour brokering, e.g. • Most unemployed have never been offered a job rather than turning down wage offers • Reservation wages likely to play more of a role at the upper end (skilled labour)
Recruitment practices • Job search affects unemployment and recruitment practices affect employment • Firms screen applicants based on productivity signals • Firms wanting to fill low-skill entry-level jobs may use other selection methods • Experience and in-house recruitment • Mitigates risk • May not advertise jobs • Does not affect # jobs on offer, but makes access to employment more exclusive
Figure – Share of working-age adults employed in informal sector
Skillsandunemployment • Skills shortage and mismatch • SA has skill-biased employment growth • 59% of unemployed • Have never worked • Have never had the opportunity to acquire on-the-job skills • Lack of vital skills and aptitudes for employment central to unemployment • Riskiness of labour market raises appeal of experienced work-seekers
Solving the unemployment crisis • Short-run: ??????? • Lon-run: more skills • Not just more education, but better education • Focus must shift from quantity to quality • Employers look for productivity signals • Is education a good productivity signal in SA?
Developing skills • FET colleges? • Artisanship training? • University? • Support for job-seekers? • Youth employment incentives • Expanded public works?