Download
1 / 8
80 likes | 97 Vues
The CASTLE Study compares the antiviral efficacy and safety of ATV/r QD and LPV/r BID in combination with TDF/FTC for HIV treatment. Results show ATV/r QD is non-inferior to LPV/r BID with less gastrointestinal toxicity and more hyperbilirubinemia.

E N D
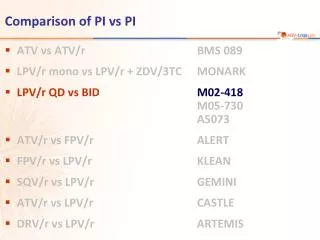
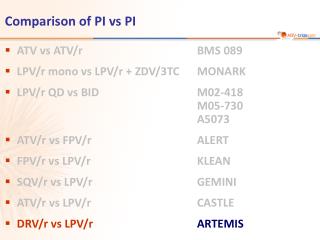
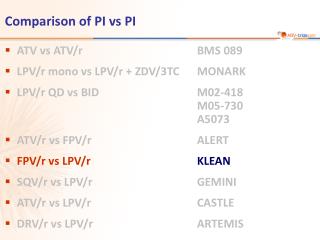
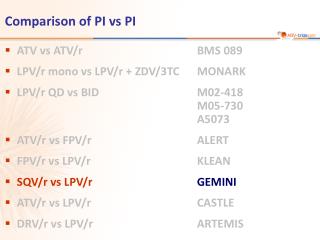
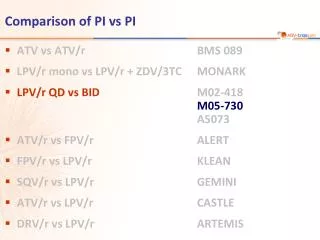
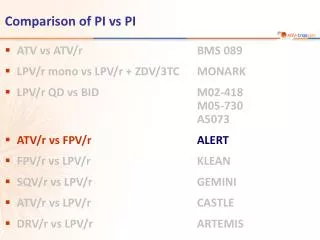
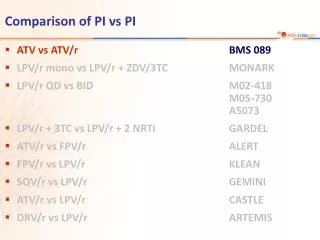
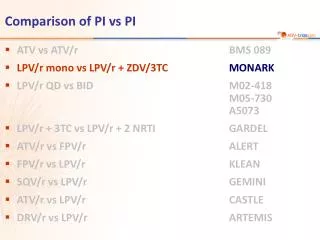
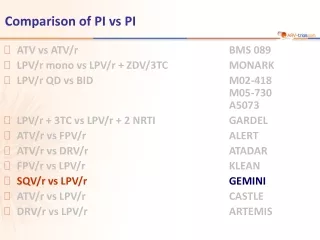
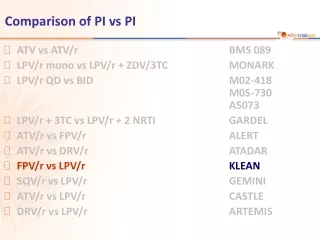
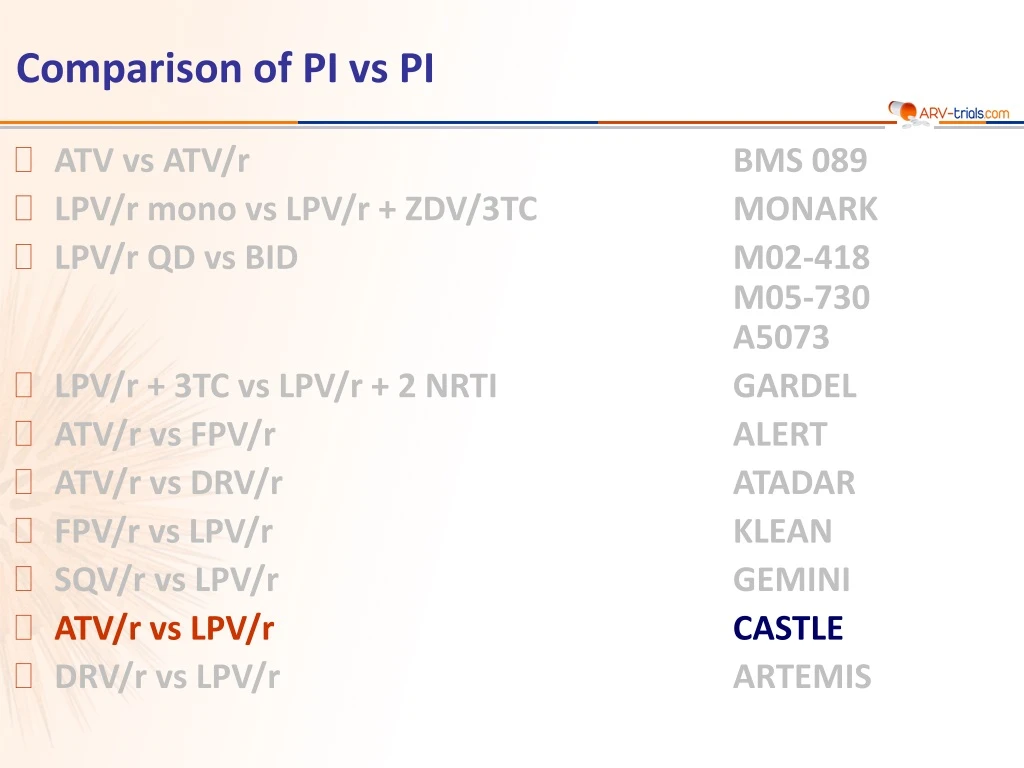
Comparison of PI vs PI • ATV vs ATV/r BMS 089 • LPV/r mono vs LPV/r + ZDV/3TC MONARK • LPV/r QD vs BIDM02-418M05-730A5073 • LPV/r + 3TC vs LPV/r + 2 NRTI GARDEL • ATV/r vs FPV/r ALERT • ATV/r vs DRV/r ATADAR • FPV/r vs LPV/r KLEAN • SQV/r vs LPV/r GEMINI • ATV/r vs LPV/rCASTLE • DRV/r vs LPV/r ARTEMIS
CASTLE CASTLE Study: ATV/r QD vs LPV/r BID,in combination with TDF/FTC • Design Randomisation* 1 : 1 Open-label W48 W96 N = 440 > 18 years ARV-naïve or < 1 week of prior ARV exposure HIV RNA > 5,000 c/mL Any CD4 cell count N = 443 *Randomisation was stratified by HIV RNA (< or > 100,000 c/mL) at screening and geographic region • Objective • Non inferiority of ATV/r vs LPV/r at W48: % HIV RNA < 50 c/mL by intentionto treat, confirmed virologic response, non completer equals failure (CVR, NC = F) (lower margin of the 2-sided 95% CI for the difference = - 10%, 90% power) Molina JM. Lancet 2008;372:646-55
CASTLE CASTLE Study: ATV/r QD vs LPV/r BID,in combination with TDF/FTC Baseline characteristics and patient disposition LPV/r was administered as soft-gel capsules during the first 48 weeks Molina JM. Lancet 2008;372:646-55
CASTLE CASTLE Study: ATV/r QD vs LPV/r BID,in combination with TDF/FTC Response to treatment at week 48 HIV RNA < 50 c/mL (ITT) HIV RNA < 50 c/mL at W48(CVR, NC = F) by baseline HIV RNA ATV/r (N = 440) Primaryanalysis % LPV/r (N = 443) 100 78 78 76 76 75 Post hoc analysis: lower virologic response rate associated with lower CD4 counts for LPV/r (p = 0.0085) but not for ATV/r (p = 0.51) 50 25 Mean CD4/mm3 increase at W48 (observed values): 203 (ATV/r) vs 219 (LPV/r) CVR, NC = F TLOVR 95% CI for the difference = - 3.8; 7.1 95% CI for the difference = - 3.6; 7.4 CVR, NC = F : confirmed virologic response, non completer equals failure Molina JM. Lancet 2008;372:646-55
CASTLE CASTLE Study: ATV/r QD vs LPV/r BID,in combination with TDF/FTC • Virologic failure • Definition: failure to achieve confirmed HIV RNA < 400 c/mL by W48, or rebound of HIV RNA > 400 c/mL after achieving confirmed HIV RNA < 400 c/mL without re-suppression, or discontinuation due to insufficient HIV RNA response before W48 * 1 patient with M46I and N88S; 1 patient with L10F, V32I, K43T, M46I, A71I, G73S, L90M Molina JM. Lancet 2008;372:646-55
Safety at W48: ATV/r vs LPV/r Serious adverse events occurred in similar proportions: 12% vs 10% Grade 2 to 4 treatment-related nausea and diarrhoea were less frequent with ATV/r: 4% vs 8% and 2% vs 11%, respectively Initiation of anti-diarrhoeal medication: 9% vs 22% Grade 2 to 4 jaundice: 4% of ATV/r patients vs none of LPV/r patients Grade 3/4 hyperbilirubinaemia: 34% vs < 1% Grade 3/4 elevations in triglycerides and total cholesterol were significantly less frequent with ATV/r: < 1% vs 4% and 7% vs 18%, respectively Median change in calculated creatinine clearance (Cockroft) was similar in both groups = - 1% Mean increases in total cholesterol, non-HDL cholesterol and triglycerides were significantly lower on ATV/r (p < 0.0001 for the 3) Use of lipid-lowering agents through W48: 2% vs 8% CASTLE CASTLE Study: ATV/r QD vs LPV/r BID,in combination with TDF/FTC Molina JM. Lancet 2008;372:646-55
Summary ATV/r QD was non inferior to LPV/r BID, when co-administered with TDF/FTC Similar virologic reponse of the 2 PI/r in patients with high HIV RNA at enrolment Results suggest reduced virologic response to LPV/r in patients with baseline CD4 < 50/mm3 mainly because of intolerance to LPV/r in this highly immunosuppressed subgroup Development of major PI-associated resistance mutations occurred in 2 ATV/r patients and no LPV/r patients Incidence of diarrhoea and nausea was lower with ATV/r than with LPV/r Incidence of hyper bilirubinemia with ATV/r was high, but less than 1% of patients discontinued due to jaundice Lipid elevations were less pronounced with ATV/r CASTLE CASTLE Study: ATV/r QD vs LPV/r BID, in combination with TDF/FTC Molina JM. Lancet 2008;372:646-55
Conclusion ATV/r QD demonstrated similar antiviral efficacy to LPV/r BID, when coadministered with TDF/FTC (1) With less gastrointestinal toxicity But with a higher rate of hyperbilirubinemia At W96 (2), HIV RNA < 50 c/mL was obtained in 74% of ATV/r patients vs 68% of LPV/r patients (p < 0.05 in the intent-to-treat analysis) confirming non-inferiority of ATV/r to LPV/r Safety analysis at W96 confirmed W48 results Treatment-related gastrointestinal adverse events were more frequent with LPV/r Hyperbilirubinemia and/or jaundice was the most frequent ATV/r-related adverse event Lipid elevations were significantly higher with LPV/r These results support current recommendation of ATV/r + TDF + FTC QD as a preferred first-line regimen for the treatment of HIV-infected patients CASTLE CASTLE Study: ATV/r QD vs LPV/r BID, in combination with TDF/FTC (1) Molina JM. Lancet 2008;372:646-55 ; (2) Molina JM. JAIDS 2010;53:323-32