Exploring Descriptive Statistics for Researchers
Learn the basics of descriptive statistics to analyze and report research data accurately, including frequencies, mean, and normality tests. Follow step-by-step procedures for data exploration and outlier detection techniques. Discover insights into student behaviors and attitudes towards money, education, and life values.

Exploring Descriptive Statistics for Researchers
E N D
Presentation Transcript
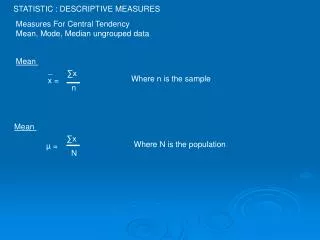
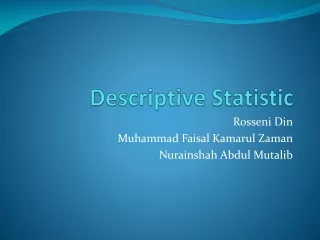
Descriptive Statistic Rosseni Din Muhammad Faisal Kamarul Zaman Nurainshah Abdul Mutalib
Why? • To describe the sample • To check the assumption • To address specific research questions
How? • Frequencies • Descriptives • Explore
Frequencies • Categorical variables • E.g. • Male vs Female
Descriptives • Continous variables • Provides: • Mean • Median • Standard deviation • Provides info on distribution of scores • Skewness • Kurtosis • Searching for missing data
Normality • Symmetrical, bell-shaped curve • Greatest frequencies in the middle and smaller are toward the extreme • Obtained by skewness and kurtosis values • Histogram can also be used
Outliers • Histogram • Look at the tails of the distribution • Boxplot • Look at the little circles with number attached • Check whether it is an error or not
Descriptive Statistic Descriptive statistic used to give a systematic general idea using Frequency, Mean and others. This test is only used to report frequencies and percentages involved in the researches conducted. The steps are:
3. Move the variables that you want to look at the frequencies
4. ClickChartsand choose any tye of charts that you wanted to use, then click ok
Data normality test in general, it is used for inferential statistic. The procedures are: • Click Analyze, Descriptive Statistics and choose EXPLORE.
2. Choose the variable that you want and then move them to Dependent List box
4. In Display, make sure both (Dependent dan Independent) is chosen.
6. for Plot, under descriptive, choose Histogram. click Normality Plots with test. Then click Continue
7. For Option, in Missing Value section, choose Exclude Cases pairwaise. Click continue then OK
8. The output will be like this: for Kolmogorof- Smirnov table, we are given information about data normality value. When the value shows non signifikan value ( value > 0.05) this shows that the data is normal
To look for OUTLIERS from the normality test procedures , we can also look for outliers in our data. This can be done using Boxplot. It is shown in small circle with number outside the boxplot as shown in the next slide:
Example of data that have outliers In this case, there are 2 data which is categorized as outliers which is respondent number 177 dan 117. in order to eliminate them we need to go back and delete this 2 data.
Money Isn’t an Issue! Only3%ofstudents talk with their parents about money. Are USD students that well off?
Do you value YOURLIFE? 60% of USD students have gotten inside a car with a drunk driver. What does this say about our respect for life?
Normal is the New Skinny Of the students that eat 0 or 1 breakfast a week, 0% are under weight. Ironically, the under weight eat.
Car or Education:What’s More Important? The less money received for an education, the more money spent on a vehicle.
Money, Money, Money USD’s tuition is $200,000 for four years. 42% of students are paying without assistance for an education that they could spend on a Ferrari.
Will we live in a virtual reality? USD students spend 90 minutes on social networks a day. How will future generations learn to socialize?
Hands-on exercise • Use survey3ED.sav from www.allenandunwin.com/spss • OR • http://rosseni.wordpress.com/2011/07/15/spss-for-beginners/
Procedure for Creating a bar graph 1. Graphs > Legacy Dialogs > Bar > Clustered 2. In Data in Chart are section, click on Summaries for groups of cases > click Define 3. In the Bars represent box click Other summaries function - click on the continuous variable of interest (e.g. total perceived stress). Click on the arrow button The variable should appear in the box listed as Mean (Total Perceived Stress). This indicates that the mean on the Perceived Stress Scale for the different groups will be displayed
Procedure for Creating a bargraph 4. Click on your first categorical variable (eg agegp3). Click on the arrow button to move it into the Category Axis box. This variable will appear across the bottom of your bar graph (x axis). 5. Click on another categorical variable (eg sex). Click on the arrow button to move it into the Define clusters by: box. This variable will be represented in the legend 6. OK