Download

1 / 13
130 likes | 264 Vues
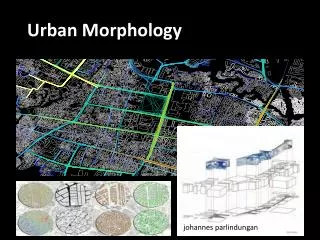
Mesoscale Urban Modeling: Inclusion of Anthropogenic Heating. Najat Benbouta Environmental Emergency Response Division, CMC. Urban Heat Island ( UHI ):. Main factors of UHI effect : Alteration of land usage Geometric urban configuration

E N D
Mesoscale Urban Modeling: Inclusion of Anthropogenic Heating Najat Benbouta Environmental Emergency Response Division, CMC
Urban Heat Island (UHI): • Main factors of UHI effect: • Alteration of land usage • Geometric urban configuration • Ground covering materials • Increase of anthropogenic heat • Traffic Vehicles (Cars, Trucks, Trains …) … ~ 60% (typical US city) • Building ( Residential, Commercial, Industrial) …. ~ 40% (typical US city) • Metabolism Heat …. ~ 2% In order to quantify the impact of these factors we must understandthe underlyingSurface Energy Balancein urban areas TEB
Ua , Ta , qa Atmospheric level Rroof Rroof Snow Rtop QH industry QE industry QHroof QE roof QHtop QE top Water Snow Troof1 Troof2 Troof3 QHwall QE wall Rwall Tcanyon qcanyon Tibld QH traffic QE traffic QHroad QE road Rroad Rroad Snow Water Snow Twall1 Twall2 Twall3 Troad1 Troad2 Troad3 Input data Prognostic variables Diagnostic variables Aude Lemonsu, CRTI-2005 Meeting
Evaluation of Anthropogenic Heating Bottom-up Approach (T. Ichinose, Japan, 1996) • Building-level energy • Detailed data required Expensive • Specific analyses Not replicated across a range of cities. • Area energy consumption for each category on business or land use in Tokyo in 1989. Annual Values Complex to generate and to maintain
Anthropogenic Heating: Top-Down Approach, Vehicle Traffic Profile D.J. Sailor, L.LU 2004 Hourly fractional traffic profiles – fv(t) for various US cities and states. Bold line is national profile from Hallenbeck et al., 1997).
Evaluation Of Anthropogenic Heating Top-down approach (D. J. Sailor, USA, 2004) Daily total energy released by 1 vehicle • ρpop(t) Population density [person/km2] • FV(t) Non-dimensional vehicle traffic profile • EVVehicle energy used per kilometer [Wkm-1] • DVD Distance traveled per person [km] • Analysis at the city scale • Hourly non-dimensional profile functions per capita • Spatial refinement through the hourly density of population profile
Chicago San Francisco 80 80 70 70 ) ) 60 60 -2 -2 50 50 40 Qf (W m 40 Qf (W m 30 30 20 20 10 10 0 0 0 8 16 24 0 8 16 24 Los Angeles Philadelphia 80 80 70 70 ) ) 60 60 -2 -2 50 50 Qf (W m 40 40 Qf (W m 30 30 20 20 10 10 0 0 0 8 16 24 0 8 16 24 Local Hour Summer Local Hour Winter Anthropogenic Heating: Top-Down Approach, Aggregated Profiles D.J. Sailor, L.LU 2004 Aggregated Qf profiles (at city-scale)
Anthropogenic Heating: Top down approach Production of a database for Canada & USA • Plan: • Search for data sources • Analysis of the data • Definition of the anthropogenic profiles per sector • Building of the anthropogenic heating database • Develop first prototype forMontreal • Validation of the approach with detailed high resolution data • Generalize to other cities of North America
Diurnal variability of demand for space cooling in summer, space heating in winter, hot water supply in winter and the diurnal variability of area energy consumption in the manufacturing and transportation. Ichinose, 1996
Anthropogenic Heating: Top-Down Approach, Electricity Profile D.J. Sailor, L.LU 2004 Representative hourly fractional electricity profiles – fe(t)
Anthropogenic Heating: Top-Down Approach, Heating Fuel Profile D.J. Sailor, L.LU 2004 0.05 9.0 0.04 7.0 0.03 5.0 hf Temp (C)) f 0.02 3.0 0.01 1.0 0.00 -1.0 0 4 8 12 16 20 24 Local Time Representative hourly heating fuel profiles
Urban Heat Island: Impact Of Anthropogenic Heating? • Results for the 6 US Cities Studied: • Heating from vehicle was the dominant in the summer for every city, 47% - 62% of the total. • Relative importance ofheating fuels increases in the winter • in the cold cities, 57% of the total for Chicago. • Metabolicheat is the least important component • 2-3% of the total heating.