Download
1 / 23
250 likes | 540 Vues
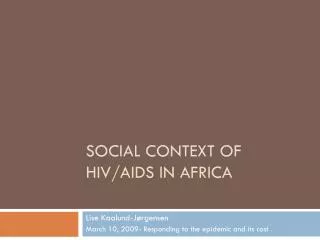
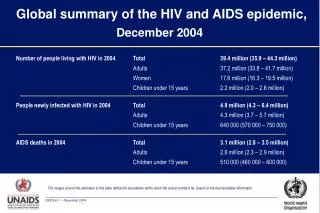
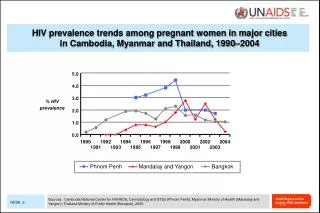
HIV prevalence trends among pregnant women in major cities in Cambodia, Myanmar and Thailand, 1990–2004. 5.0. % HIV prevalence. 4.0. 3.0. 2.0. 1.0. 1990. 1992. 1994. 1996. 1998. 2000. 2002. 2004. 1991. 1993. 1995. 1997. 1999. 2001. 2003. 0.0. Phnom Penh.

E N D
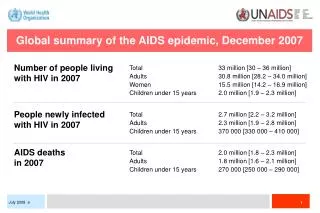
HIV prevalence trends among pregnant women in major cities in Cambodia, Myanmar and Thailand, 1990–2004 5.0 % HIV prevalence 4.0 3.0 2.0 1.0 1990 1992 1994 1996 1998 2000 2002 2004 1991 1993 1995 1997 1999 2001 2003 0.0 Phnom Penh Mandalay and Yangon Bangkok Sources: Cambodia National Center for HIV/AIDS, Dermatology and STDs (Phnom Penh); Myanmar Ministry of Health (Mandalay and Yangon); Thailand Ministry of Public Health (Bangkok), 2005. 2.10
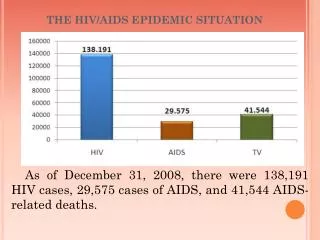
Trend in HIV prevalence in 21-year-old military conscripts in Thailand: 1989-1999 5 4 3 HIV prevalence (%) 2 1 0 1989 1990 1991 1992 1993 1994 1995 1996 1997 1998 1999 Source: Armed Forces Research Institute of Medical Sciences, Thailand
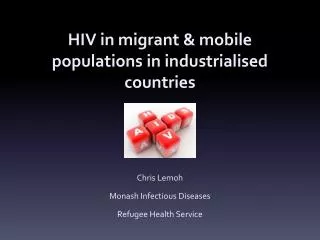
Illustration de la possibilité de diffusion du VIH des groupes à risques vers la population générale Cette diffusion dépend des liens qui existent entre ces populations à risque et la population générale Taille de la population à risque, liens avec la population générale ? Populations à risque • Homosexuels masculins • Usagers de drogues • Patients atteints d’une IST • Migrants • Prostituées General population EuroHIV
Drivers of the epidemic: familiar pattern in countries 90% SW Spouse 5% IDU 5% 50% Spouse SW 15% IDU 20% MTCT 15% 70% IDU SW 26 % Source: Thai Working Group on HIV/AIDS Projections, 2001
Projected total number of HIV infections in various population groups, in Jakarta, Indonesia, 2000–2020 200 000 IDUs with HIV Wives of IDU with HIV Other heterosexuals infected with HIV in a chain originating with IDU 160 000 120 000 80 000 Number of HIV infections 40 000 0 2000 2001 2002 2003 2004 2005 2006 2007 2008 2009 2010 2011 2012 2013 2014 2015 2016 2017 2018 2019 2020 Source: Asian Epidemic Model projections using Jakarta data. 2.15
HIV prevalence (%) in adults (15–49) in Eastern Europe and Central Asia, 2007 2.16
120 000 105 000 90 000 75 000 60 000 45 000 30 000 15 000 0 Increase in reported HIV cases in the Russian Federation and Ukraine, 1987–2005 Reported HIV cases in the Russian Federation Reported HIV cases in Ukraine 400 000 Russian Federation 350 000 Newly reported cases 300 000 Cumulative (previous years) 250 000 Ukraine 200 000 Newly reported cases 150 000 Cumulative (previous years) 100 000 50 000 0 1987 1989 1991 1993 1995 1997 1999 2001 2003 2005 Sources: Russian Federal AIDS Centre; Ukranian AIDS Centre and Ministry of Health of Ukraine 2.12
HIV prevalence (%) in adults (15–49) in the Caribbean, 2007 2.17
HIV prevalence (%) in adults (15–49) in Latin America, 2007 2.18
Argentina Ecuador Quito Buenos Aires Provinces (7 cities) Guayaquil Bolivia La Paz Other city ports (4) Paraguay Asunción and 4 other cities Santa Cruz Peru Border cities with Argentina Lima Chile 0.0 Santiago Provinces Colombia Uruguay Bogotá Montevideo Border cities with Brazil 0 5 10 15 20 25 30 Venezuela 0.0 % HIV prevalence Isla Margarita 0 5 10 15 20 25 30 % HIV prevalence Female sex workers Men who have sex with men HIV prevalence (%) among female sex workers and men who have sex with men in Latin America, 1999–2002 Source: Montano SM et al., JAIDS (2005). 2.14
HIV prevalence (%) in adults (15–49) in North America, Western and Central Europe, 2007 2.19
HIV infections newly diagnosed in injecting drug users and men who have sex with men, by country, and year of report, 2002–2006 3000 Men having sex with men Canada 2000 France Germany 1000 Italy Netherlands 0 Switzerland 2002 2003 2004 2005 2006 United Kingdom 600 Sources: (1) Public Health Agency of Canada. HIV and AIDS in Canada. Selected Surveillance Tables to June 30, 2007. Surveillance and Risk Assessment Division, Centre for Infectious Disease Prevention and Control, Public Health Agency of Canada, 2007. (2) Epidemiologisches Bulletin (5. Oktober 2007/Sonderausgabe B aktuelle daten und informationen zu infektionskrankheiten und public health). (3) The UK Collaborative Group for HIV and STI Surveillance Testing Times. HIV and other Sexually Transmitted Infections in the United Kingdom: 2007. London: Health Protection Agency, Centre for Infections. November 2007. (4) EuroHIV. HIV/AIDS Surveillance in Europe. End-year report 2006. Saint-Maurice: Institut de veille sanitaire, 2007. No. 75. (5) EuroHIV. HIV/AIDS Surveillance in Europe. Mid-year report 2007. Saint-Maurice: Institut de Veille Sanitaire, 2007. No. 76. Injecting drug users 400 200 0 2002 2003 2004 2005 2006 2.20
Annual diagnoses of HIV infection and AIDS in Australia 1981–2006 HIV diagnoses AIDS diagnoses 2400 2000 1600 Number of diagnoses 1200 800 400 0 1981 1986 1991 1996 2001 2006 Year Source: National Centre in HIV Epidemiology and Clinical Research, 2007. Data available at http://www.nchecr.unsw.edu.au/NCHECRweb.nsf/resources/SurvRep07/$file/ASR2007.pdf 2.23
Number and percentage of HIV-positive pregnant women receiving antiretroviral prophylaxis, 2004–2007 40 600 000 35 500 000 30 400 000 Number of HIV-positive pregnant women receiving anti-retrovirals % of HIV-positive pregnant women receiving anti-retrovirals 25 300 000 20 15 200 000 10 100 000 5 0 0 2004 2005 2006 2007 Year Source: UNAIDS, UNICEF & WHO, 2008; data provided by countries. 4.13
Percentage of young people aged 15–24 reporting the use of a condom during sexual intercourse with a non-regular partner, Sub-Saharan Africa, 2001–2005 Benin 2001 Botswana 2001 Countries with date of survey indicated Burkina Faso 2003 Cameroon 2004 Chad 2004 Ghana 2003 Guinea 2005 Kenya 2003 Lesotho 2004 Madagascar 2003 Malawi 2004 Mali 2001 Mozambique 2003 Nigeria 2003 Rwanda 2004 Senegal 2005 United Republic of Tanzania 2003 Uganda 2004 Zambia 2003 0 10 20 30 40 50 60 70 80 90 100 % Female Male Sources: Demographic Health Surveys; HIV/AIDS Indicator Surveys (2001-2005). 3.6
Comprehensive knowledge of HIV among young people, by type of question 100 Males Females 80 60 (%) correct 40 20 0 Sharing food does not transmit HIV All 5 questions are correct Having only one faithful partner can protect against HIV Condoms can prevent HIV A healthy looking person can have HIV Mosquitos do not transmit HIV QUESTION Source: UNGASS Country Progress Reports 2008. 4.4
Percentage of HIV-positive pregnant women receiving antiretroviral prophylaxis, 2007 Source: UNAIDS, UNICEF & WHO, 2008; data provided by countries. 4.14
Total annual resources available for AIDS 1986–2007 10 billion 10 000 8.9 billion 9000 US$ million Signing of Declaration of Commitment on HIV/AIDS,UNGASS 8000 8.3 billion 7000 6000 World Bank MAP launch 5000 4000 Gates Foundation PEPFAR 3000 UNAIDS Less than US$ 1 million 2000 1623 1000 Global Fund 292 257 212 59 0 2006 2007 1986 1987 1990 1991 1992 1993 1996 1997 1998 1999 2000 2001 2002 2003 2004 2005 Notes: [1] 1986-2000 figures are for international funds only; [2] Domestic funds are included from 2001 onwards [i]1996-2005 data: Extracted from 2006 Report on the Global AIDS Epidemic (UNAIDS, 2006); [ii] 1986-1993 data: Mann.&. Tarantola, 1996 Source: UNAIDS & WHO unpublished estimates, 2007 7.1
Distribution by region of the funding required for treatment and care Latin America/Caribbean: 17% Eastern Europe: 7% North Africa/Middle East: 1% Africa: 55% South/South-East Asia: 4% East Asia/Pacific: 16% Source: UNAIDS (2005). Resource needs for an expanded response to AIDS in low- and middle-income countries. 10.6
www.unaids.org www. eurohiv.org www.invs.sante.fr