Download
1 / 11
110 likes | 203 Vues
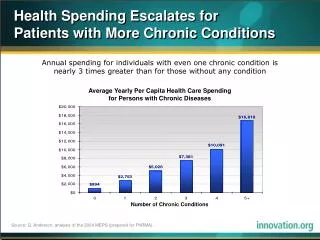
Explore international comparisons of health spending as % of GDP and per capita. Data on hospital spending, physician incomes, surgeries, and cancer survival rates. Source: OECD Health Data

E N D
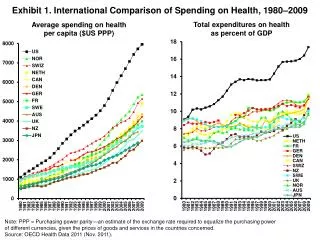
Total expenditures on healthas percent of GDP Average spending on healthper capita ($US PPP) Exhibit 1. International Comparison of Spending on Health, 1980–2009 Note: PPP = Purchasing power parity—an estimate of the exchange rate required to equalize the purchasing power of different currencies, given the prices of goods and services in the countries concerned. Source: OECD Health Data 2011 (Nov. 2011).
Exhibit 5. Hospital Spending per Discharge, 2009Adjusted for Differences in Cost of Living Dollars * 2008. ** 2007. Source: OECD Health Data 2011 (Nov. 2011).
Exhibit 7. Physician Incomes, 2008Adjusted for Differences in Cost of Living Dollars Orthopedic physicians Primary care doctors Source: M. J. Laugesenand S. A. Glied, “Higher Fees Paid to U.S. Physicians Drive Higher Spending for Physician Services Compared to Other Countries,” Health Affairs,Sept. 2011 30(9):1647–56.
Exhibit 8. Volume of Knee and Hip Replacements, 2009 Hip replacements per 100,000 population Knee replacements per 100,000 population * 2008. ** 2007. Source: OECD Health Data 2011 (Nov. 2011).
Exhibit 10. Five-Year Survival Rate for Select Cancers, 2004–2009 Percent Note: Breast and cervical cancer rates are age-standardized; colorectal cancer rates are age–sex standardized. * 2003–08. ** 2002–07. Source: OECD Health Data 2011 (Nov. 2011).