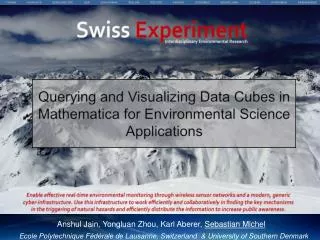
Querying and Visualizing Environmental Data Cubes using Mathematica
300 likes | 416 Vues
This presentation explores the use of data cubes for environmental science applications, highlighting the development of a web-based infrastructure in Switzerland tailored for collaborative research. The Swiss Experiment project serves various environmental studies by enabling efficient data sharing and visualization. We present our approach to creating a data cube, the technologies involved, and how scientists can interact with the data through familiar mathematical tools. Moreover, we discuss the system architecture and demonstrate example usage with plots generated through our approach.

Querying and Visualizing Environmental Data Cubes using Mathematica
E N D
Presentation Transcript
Querying and Visualizing Data Cubes in Mathematica for Environmental Science Applications Anshul Jain, Yongluan Zhou, Karl Aberer, Sebastian Michel Ecole Polytechnique Fédérale de Lausanne, Switzerland & University of Southern Denmark
Outline • What we do in Switzerland (short intro) • Motivation/Problem Statement • Our Approach • Review of used Technology • System Architecture • Example Usage • Some Plots • Conclusion
SwissExperiment Interdisciplinary Environmental Research • Swiss Experiment: • Provision of a generic infrastructure of: • web based technologies • wireless communications • low cost high density sensors • to serve the environmental science community • encourage collaboration • provide a portal for public information on environmental research www.swiss-experiment.ch
SwissEx Infrastructure • SwissEx infrastucture is built to serve many environmental research projects • Where experimental areas overlap, projects can work more efficiently by sharing data • Projects can benefit from external data sources
Example Deployment Le Genepi Glacier, close to Martigny, Switzerland
Previous State (Near) Future • Lack of communication • Information Sharing in online communities • Randomly distributed data files • Data repository with single access point • Data loss • No data loss • Loss of knowledge on data collection • Provenance tracking • Waste of resources replicating data collection • Data reuse • Small user community • Open access
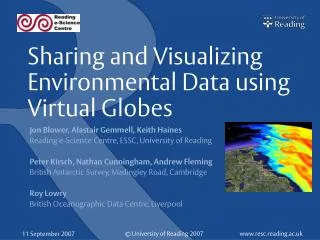
Visualization/Sharing/Metadata Capturing Talk this Thursday afternoon @ eScience conference
Observations • Large amounts of data • Environmental scientists (avalanche research, hydrology, ....) • Scientists analyze data (statistics,....) • No time to learn new CS tools (science is what matters at the first place) • Scientists store data in relational DBs (SQL queries), or files
Using SQL ? SELECT avg (val),avg (nod),mi FROM (SELECT d_value, n_id, dateadd (minute,floor ( Datediff (minute,'20000101',d_time)/60)*60,' 20000101') FROM mathTable WHEREn_id=2 AND s_id = 1 ) as w(val,nod,mi) WHERE (mi < SQLDateTime{2007,9,27,11,0,0} AND mi>=SQLDateTime{2007,9,27,10,0,0}) GROUP BY mi order by mi asc SQL query for calculating smoothened (over 60 mins) AmbientTemperature value
Problem Statement / Wish list • Visualization of huge data sets (data sensed by sensor network over a long period) • Support of featureswhich other front end tools lack for plotting graphs • Interaction with mathematical tools scientists use already
Approach • Create a data cube over the environmental data • Provide a Web service interface • Extend mathematical tools • query the cube (without learning MDX) • standard plots
Data Cubes • Quickly provide answers to analytical queries that are multi-dimensional in nature • Pre-calculation of data and storage cube form • Typical applications: • business reporting for sales • marketing • management reporting • budgeting and forecasting, financial reporting and similar areas • data mining in general
Microsoft SQL server 2005 and Microsoft SQL Server Analysis Services Microsoft Visual Studio 2008 Wolfram Mathematica 7 Microsoft Internet Information Services Technologies Used
Web Services • Web Service • In common usage the term refers to clients and servers that communicate using XML messages • Server will host the service • Any computer on the network can use the service • Messages follow the SOAP (Simple Object Access Protocol) standard • Machine-readable description of the operations offered by the service written in the Web Services Description Language (WSDL) • Drawback • Message size increases because of XML
Web Services and their Applications • Using Web services is supported in tools like Mathematica and MATLAB • For plotting one graph: • amount of data transferred in our architecture is very small • E.g., ~2 Kilobytes of data is transferred for one plot from the analysis server to the client.
Steps for Plotting and Analysis • Install the Web service • Import Mathematica packages • Define data source • Define cube elements( dimensions, hierarchy, members on rows and columns) to be used • Define measure(e.g., average) • Generate the MDX query • Execute query using Web services • Parse the data(XML) returned by web service • Call the desired plotting function
MDX Query Generation • sensorID = "1";(*getting the ambient temperature*) • measure = "[measures].[sum]/[measures].[count]";(* This measure is for getting the average*) • cubeelements = {{"node","node",{"32","31", "29"}}, {"timeline","[yymmddhh]",{"2007-09-27 00","2007-09-27 01","2007-09-27 02","2007-09-27 03","2007-09-27 04","2007-09-27 05","2007-09-27 06","2007-09-27 07","2007-09-27 08","2007-09-27 09","2007-09-27 10","2007-09-27 11","2007-09-27 12","2007-09-27 13","2007-09-27 14","2007-09-27 15","2007-09-27 16","2007-09-27 17","2007-09-27 18","2007-09-27 19","2007-09-27 20","2007-09-27 21","2007-09-27 22","2007-09-27 23"}}, {"sensor","sensor",{sensorID}}} ; • datasource = "[stbernard]"; • mdxquery = getQuery[datasource, measure, cubeelements];
Parameters Monitored • Ambient temperature • Surface temperature • Solar radiation • Relative humidity • Soil moisture • Water mark • Rain meter • Wind speed • Wind direction http://sensorscope.epfl.ch/
Calculations • Average Wind Speed • Sqrt[Average wind speed in North direction²+ Average wind speed in East direction²] • Sensible Heat Flux = -ChρcPu(Tair-Tsfc) • Ch:Heat transfer Coefficient • ρ:air density • cP: Specific heat for dry air • u: wind speed • Contour plots • Inverse Distance Interpolation
Conclusion • Web service interface between Mathematical tools and the data cube • Several visualization functions are provided in a package • Pre-calculation of certain aggregates for faster query execution and less data transfer • Automatic MDX query generation • Easy to install, easy to use
Swiss Experiment Questions Interdisciplinary Environmental Research