
AVIATION 120
E N D
Presentation Transcript
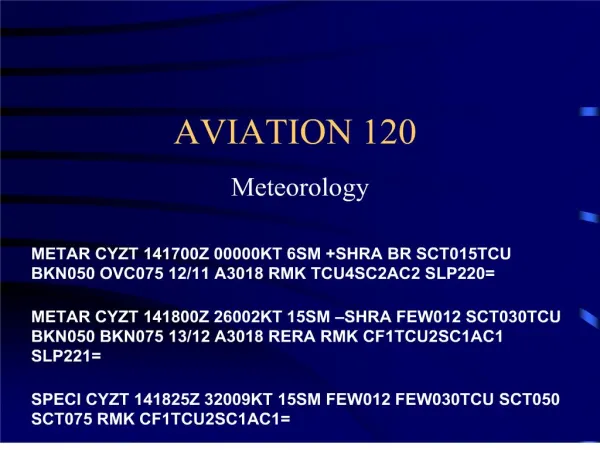
1. AVIATION 120 Meteorology
2. Today�s Agenda NOTE: Tour of FSS TBA
Graphical Area Forecast (GFA)
General Information
Area Coverage
Issue and Valid Times
Page Layout
Content
Clouds and Weather Chart
Icing, Turbulence and Freezing Level Chart
GFA Amendments
GFA Corrections
Example GFAs
3. GFA � General Information Graphical Area Forecasts replaced alphanumeric Area Forecasts (FAs) in April 2000.
Refer to AIM 3.3 for detailed information
Also refer to NAV CANADA web page � links for non kiosk users - GFA
GFA provides a graphic depiction of the most probable meteorological conditions expected to occur between the surface and 400 mb (24 000�) over a given area at a specified time.
Designed to service flight planning requirements for general aviation and regional air carrier operations.
GFA consists of 6 charts:
Two valid at T0 (the beginning of the forecast period);
Two valid at T0+6hr (six hours into the forecast period);
Two valid at T0+12hr (the end of the forecast period);
In addition, the T0+12hr clouds and weather chart includes a worded IFR outlook for an additional 12 hour period
Of the two charts valid at any particular time, one depicts the clouds and weather, the other depicts icing, turbulence and freezing level for the same time and area
4. GFA � General Information (cont.) Units:
Speeds are always in knots (KT)
Heights are in hundreds of feet ASL unless otherwise specified
Horizontal visibilities are in statute miles (SM)
Distances are in nautical miles (NM)
Time is UTC
Pressure is in millibars (mb) and isobars are spaced at 4mb intervals
Abbreviations are the same as METAR/SPECI/TAF
Symbols used are consistent with those used on similar meteorological products such as the Significant Wx Prognostic charts and are listed in the AIM
GFA background and scale:
Background will contain at least the following:
provincial, federal and territorial boundaries; oceans, coastlines and major lakes
Scale is chosen to allow the map to fit in the appropriate space on the chart. All charts include a scale bar in their corresponding legend box.
5. Area Coverage
6. Issue and Valid Times The GFA is issued to reach users approximately � hour before the beginning of the forecast period � that is � hour before T0
GFAs are issued at 2330, 05:30, 11:30 and 17:30 UTC and are valid at 00:00, 06:00, 12:00 and 18:00 UTC respectively (these are the main synoptic hours)
Each new set of GFA charts replaces the preceding ones
7. GFA Page Layout Each GFA chart is divided into 4 parts:
Title box (upper right hand corner)
Chart name
Issuing office 4 letter ICAO identifier
Name of the GFA region
Chart type
Date/time of issue
Valid date/time
Legend box (immediately below title box)
Includes weather symbols that may be used
Includes a NM scale bar
8. GFA Page Layout (cont.) Comments Box
Provides information that the forecaster considers important
May describe weather elements that are difficult to render pictorially or if added would cause the chart to become cluttered
Standard phrases are also included in the comments box
IFR outlook is included in the T0+12hr Clouds and Wx comments box
9. Weather Information
Depicts either a forecast of the clouds and weather conditions or a forecast of the icing, turbulence and freezing level conditions for a specified time
10. Content of the GFA Clouds and Weather Chart
This chart provides a forecast of cloud layers and/or surface based phenomena, visibility, weather and obstructions to vision at the valid time of the particular chart
Isobars are depicted at 4mb intervals on the clouds and weather chart only
Synoptic features that are responsible for the portrayed weather are also depicted with an indication of their direction and speed of movement
Synoptic features:
The motion of synoptic features when the speed of movement is forecast to be 5KT or more will be indicated.
For speeds less than 5KT, QS (quasi-stationary) is used.
Synoptic features may include fronts, high or low pressure centers, troughs etc.
11. Clouds:
The bases and tops of forecast clouds between the surface and 24000� will be indicated
The tops of convective cloud are indicated, even if they extend above 24 000�
Convective cloud will always be indicated if forecast to be present
Cirrus cloud is not depicted
Areas of organized BKN or OVC cloud will be enclosed with a scalloped brown border:
Areas where organized cloud is not forecast and visibility is expected to be greater than 6SM, a scalloped border is not used. In these areas, sky condition is described using SKC, FEW or SCT.
Significant cloud layers are based on the forecast amount at each level, NOT on the summation amount
12. Surface Based Layers:
Described in abbreviated plain English
Vertical Visibility is stated in hundreds of feet when appropriate
OBSCD (obscured) is used to describe surface-based layers. EG: OBSCD CIGS 3-5 AGL means obscured ceilings with vertical visibility of between 300 and 500 feet above ground level
Visibility:
The visibility in SM is always included
When visibility is expected to be greater than 6 SM, P6SM is used
Weather and Obstructions to Vision:
Weather, when expected, is always included immediately after the visibility. On the other hand, obstructions to vision are mentioned only when the visibility is forecast to be 6 SM or less.
When visibility is forecast to be less than 6 SM, the weather and/or obstructions to vision are always stated. EG 2-4 SM �RA BR
Only standard abbreviations are used to describe weather and obstructions to vision
13. Weather and Obstructions to Vision (cont.):
If the weather and/or obstructions to vision do not cover the entire area within the cloud shield, the sub-area is defined by border lines
Continuous green lines are used to enclose areas of continuous precipitation, dashed green lines are used to enclose areas of intermittent precipitation and dashed orange lines are used to enclose areas of obscuring phenomena other than precipitation:
14. Weather and Obstructions to Vision (cont.):
Weather and obstructions to vision in the GFA may include spatial qualifiers which describe the coverage of the depicted meteorological phenomena:
Convective clouds and showers:
Non convective clouds and precipitation, low stratus ceilings, precipitation ceilings, icing, turbulence and restrictions to visibility:
15. Strong Surface Winds:
The direction and speed of strong surface winds are indicated by using wind barbs for wind speed and direction for all areas where winds are expected to have a mean sustained speed of at least 20 knots.
Wind gusts are indicated when speeds of at least 10 knots greater than the mean sustained winds are forecast. Gusts are indicated with the letter �G� followed by the gust speed in knots, enclosed in a box:
When accompanied by strong gusts, mean sustained winds of less than 20 knots may also be indicated in the GFA at the forecaster�s discretion, if moderate mechanical turbulence is expected to occur as a result of the gusts
IFR Outlook:
The outlook is included in the comments box of the T0+12hr clouds and weather chart
Is fairly general and indicates the main areas where IFR weather is expected in the next 12 hours
It should state the cause of the IFR weather, along with weather hazards, if any
16. IFR Outlook:
For Meteorological purposes, the IFR outlook is based on the following:
17. Icing, Turbulence and Freezing Level Chart
This chart provides a forecast of areas where icing and turbulence are expected as well as the expected freezing level at a specific time.
Chart includes type, intensity, bases and tops of each forecast icing and turbulence area
Surface synoptic features such as fronts and pressure centers are shown
This chart should be used in conjunction with the clouds and weather chart issued for the same valid period
Icing:
Icing is depicted whenever moderate or severe icing is forecast for the coverage area
Bases and tops of each icing layer, measured in hundred of feet ASL as well as the type (CLR, MXD, RIME) will be indicated when they are known
Light icing areas are described in the comments box
If icing is expected to only be present during a part of the forecast period covered by the chart, the time of occurrence is indicated in the comments box
Icing intensity reported as per MET 2.4
18. Turbulence:
Turbulence is depicted whenever moderate or severe turbulence is forecast for the coverage area
The base and top of each turbulence layer is measured in hundreds of feet ASL.
If the turbulence is due to mechanical turbulence, low-level wind shear, lee/mountain waves, a significant low-level jet or is in clear air, an abbreviation indicating the cause will be included:
MECH, LLWS, LEE WV, LLJ, or CAT
Turbulence intensity reported as per and MET 3.7
19. Freezing level:
Freezing level is depicted with contours spaced at 2500 foot ASL intervals starting at the surface
Modifications to the freezing level, such as above freezing level layers aloft and temporal changes are explained in the comments box
20. GFA Amendments The GFA is automatically amended by AIRMET bulletins whenever weather conditions that are considered significant to aviation have not been forecast and subsequently occur, or when they have been forecast but do not occur.
Each AIRMET will indicate which GFA is being amended.
In addition the GFA is automatically amended by SIGMET bulletins, even though it is not explicitly stated in the SIGMET itself.
21. GFA Corrections The GFA will be re-issued in the event that one or more of the original GFA charts contains a significant error which, if left uncorrected, could result in an erroneous interpretation of the GFA.
Only the erroneous GFA chart is corrected and re-issued with an appropriate explanation in the comments box
When re-issued, the correction code "CCA" is added to the first line of the Title Box to indicate the first correction, "CCB" for the second, "CCC" for the third, etc.
22. GFA Examples Clouds and Weather
Icing, Turbulence and Freezing Level