Download
1 / 13
130 likes | 233 Vues
Explore industry opportunities, firm resources & capabilities, and strategic management perspectives for superior profitability. Understand industry structure, competitive forces, and strategic decision-making for sustainable success.

E N D
Industry Analysis Strategic Management
Firm Resources & Capabilities Sources of Superior Profitability Attractive Industry Superior Profitability
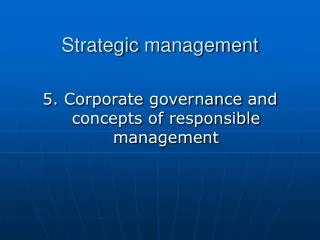
Historical ROE Spreads Across Industries(1976-91) Equity Spread (ROE-Ke) Soft Drinks 13 Ethical Drugs 11 Tobacco - mean = 1 . 3 9 std.dev. = 5 . 0 7 Grocery Stores 5 Publishing 3 Food Wholesalers Integrated Oil 1 Hotels/Gaming Basic Chemicals -1 Packaging & Container -3 Tire & Rubber Auto & Truck Mfg. -5 Metals & Mining -7 Textiles -9 -11 Air Transport -13 Steel -15 Number of Industries Oil Field Services -17 0 2 4 6 8 10 12 14 16 18 Source: Marakon Associates, Value Line
Industry Opportunities STRATEGY Firm Resources and Capabilities Perspectives on Strategic Management -Analyze industry structure -Superior product positioning in an attractive industry “Industry Structure” HOW TO BUILD SUSTAINABLE COMPETITIVE ADVANTAGE -Analyze firm resources -Develop unique resources and capabilities “Firm Capability”
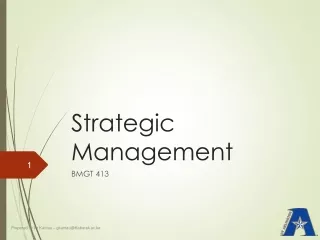
Threat of New Entrants Rivalry among Existing Competitors Bargaining Power of Suppliers Bargaining Power of Buyers Threat of Substitutes “Industry Structure” Perspective“Five Forces” Analysis of Competitive Strategy
Industry A D B C Barriers to EntryWhat factors keep potential competitors out? • Scale economies • e.g., aerospace industry • Scope economies • e.g., retailing • Capital requirements • e.g., aerospace industry • Switching costs • e.g., Windows operating system • Access to distribution • e.g., soft drinks • Product Complexity • e.g., supercomputers, microprocessors • Entry deterring regulations • e.g., Tobacco
A C D B Customers Threat of SubstitutesWhat alternatives are available to customers Industry • Direct substitution with the same functionality • diesel vs gas engines • DirecTV vs cable • Eliminating need for product • water meters vs flat rate
A C B Nature and Focus of RivalryWhy industries are more or less “competitive”? • Factors • Industry growth rates • Where to secure growth • Exit barriers • e.g., specialized assets, emotional barriers • Fixed costs • e.g. capacity increments • Lack of product differentiation • e.g. differences in functionality, performance • Switching costs Industry Competitive rivalry can focus on many factors, including price, quality, technology, features, service, etc.
Buyer Power Buyer concentration Few vs many customers Volume of purchases Large vs small purchase decisions Available alternative products Competitive products Threat of backward integration Ability to become a competitor Switching costs Threat of switching suppliers Supplier Power Supplier concentration Few vs many suppliers Supplier volume Large vs small purchase decisions Product differences Dependence on unique features Threat of forward integration Ability to become competitor Switching costs Limitations on ability to change suppliers Supplier or Buyer PowerHow can my suppliers or customers extract value
How Industry Structure Influences Profitability Others (>10) (20%) Green Giant (4%%) Percent of Market Others (>1000) (90%) Campbell (17%) Others (>10,000) Swanson (25%) Stouffer (34%) American (2%) ConAgra (1%) Kroger(3%) Safeway (4%)
THREAT OF ENTRY • HIGH • entrants have cost advantages • moderate capital requirements • little product differentiation • deregulation of governmental barriers Example: Airlines • INDUSTRY COMPETITIVENESS • HIGH • many companies • little differentiation • excess capacity • high fixed/variable costs • cyclical demand BUYER POWER MEDIUM/HIGH Buyers extremely price sensitive Good access to information Low switching costs • SUPPLIER POWER • HIGH • strong labor unions • concentrated aircraft makers • THREAT OF SUBSTITUTES • MEDIUM • Autos/train for short distances Source: J. de la Torre
THREAT OF ENTRY • LOW • economies of scale • capital requirements for R&D and clinical trials • product differentiation • control of distribution channels • patent protection Example: Pharmaceuticals • INDUSTRY COMPETITIVENESS • LOW • high concentration • product differentiation • patent protection • steady demand growth • no cyclical fluctuations of demand BUYER POWER LOW Physician as buyer: Not price sensitive No bargaining power. (Changing with managed care.) SUPPLIER POWER LOW THREAT OF SUBSTITUTES LOW No substitutes. (Changing as managed care encourages generics.) Source: J. de la Torre
Minimize buyer power (e.g., build customer loyalty) Offset supplier power (e.g., alternative source(s)) Avoid excessive rivalry (e.g., attack emerging vs entrenched segments) Raise barriers to entry (e.g., make preemptive investments) Reduce the threat of substitution (e.g., incorporate their benefits) Successful Strategies Should: