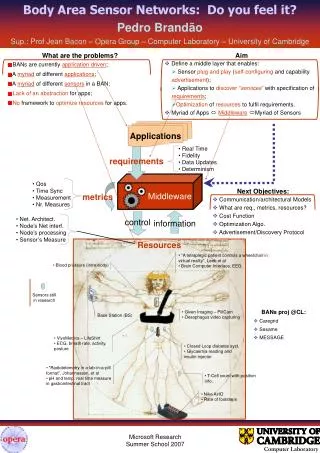
Applications
Regression http://numericalmethods.eng.usf.edu Transforming Numerical Methods Education for the STEM undergraduate. Applications. Mousetrap Car. http://www.youtube.com/watch?v=XZ23q0QXPx0&t=1m25s. Torsional Stiffness of a Mousetrap Spring. Stress vs Strain in a Composite Material.

Applications
E N D
Presentation Transcript
Regressionhttp://numericalmethods.eng.usf.eduTransforming Numerical Methods Education for the STEM undergraduate http://numericalmethods.eng.usf.edu Transforming Numerical Methods Education for the STEM Undergraduate
Applications http://numericalmethods.eng.usf.edu Transforming Numerical Methods Education for the STEM Undergraduate
Mousetrap Car http://www.youtube.com/watch?v=XZ23q0QXPx0&t=1m25s http://numericalmethods.eng.usf.edu Transforming Numerical Methods Education for the STEM Undergraduate
Torsional Stiffness of a Mousetrap Spring http://numericalmethods.eng.usf.edu Transforming Numerical Methods Education for the STEM Undergraduate
Stress vs Strain in a Composite Material http://numericalmethods.eng.usf.edu Transforming Numerical Methods Education for the STEM Undergraduate
A Bone Scan http://numericalmethods.eng.usf.edu Transforming Numerical Methods Education for the STEM Undergraduate
Radiation intensity from Technitium-99m http://numericalmethods.eng.usf.edu Transforming Numerical Methods Education for the STEM Undergraduate
Trunnion-Hub Assembly http://numericalmethods.eng.usf.edu Transforming Numerical Methods Education for the STEM Undergraduate
Thermal Expansion Coefficient Changes with Temperature? http://numericalmethods.eng.usf.edu Transforming Numerical Methods Education for the STEM Undergraduate
Pre-Requisite Knowledge http://numericalmethods.eng.usf.edu Transforming Numerical Methods Education for the STEM Undergraduate
Close to half of the scores in a test given to a class are above the • average score • median score • standard deviation • mean score http://numericalmethods.eng.usf.edu Transforming Numerical Methods Education for the STEM Undergraduate
Given y1, y2,……….. yn,the standard deviation is defined as • . • . • . • . http://numericalmethods.eng.usf.edu Transforming Numerical Methods Education for the STEM Undergraduate
Linear Regression http://numericalmethods.eng.usf.edu Transforming Numerical Methods Education for the STEM Undergraduate
Given (x1,y1), (x2,y2),……….. (xn,yn), best fitting data to y=f (x) by least squares requires minimization of • ) • ) • ) • ) http://numericalmethods.eng.usf.edu Transforming Numerical Methods Education for the STEM Undergraduate
The following data • -136 • 400 • 536 is regressed with least squares regression to a straight line to give y=-116+32.6x. The observed value of y at x=20 is http://numericalmethods.eng.usf.edu Transforming Numerical Methods Education for the STEM Undergraduate
The following data • -136 • 400 • 536 is regressed with least squares regression to a straight line to give y=-116+32.6x. The predicted value of y at x=20 is http://numericalmethods.eng.usf.edu Transforming Numerical Methods Education for the STEM Undergraduate
The following data • -136 • 400 • 536 is regressed with least squares regression to a straight line to give y=-116+32.6x. The residual of y at x=20 is http://numericalmethods.eng.usf.edu Transforming Numerical Methods Education for the STEM Undergraduate
Nonlinear Regression http://numericalmethods.eng.usf.edu Transforming Numerical Methods Education for the STEM Undergraduate
When transforming the data to find the constants of the regression model y=aebx to best fit (x1,y1), (x2,y2),……….. (xn,yn), the sum of the square of the residuals that is minimized is http://numericalmethods.eng.usf.edu Transforming Numerical Methods Education for the STEM Undergraduate
When transforming the data for stress-strain curve for concrete in compression, where is the stress and is the strain, the model is rewritten as • ) • ) • ) • ) http://numericalmethods.eng.usf.edu Transforming Numerical Methods Education for the STEM Undergraduate
Adequacy of Linear Regression Models http://numericalmethods.eng.usf.edu Transforming Numerical Methods Education for the STEM Undergraduate
The case where the coefficient of determination for regression of n data pairs to a straight line is one if • none of data points fall exactly on the straight line • the slope of the straight line is zero • all the data points fall on the straight line http://numericalmethods.eng.usf.edu Transforming Numerical Methods Education for the STEM Undergraduate
The case where the coefficient of determination for regression of n data pairs to a general straight line is zero if the straight line model • has zero intercept • has zero slope • has negative slope • has equal value for intercept and the slope http://numericalmethods.eng.usf.edu Transforming Numerical Methods Education for the STEM Undergraduate
The coefficient of determination varies between • -1 and 1 • 0 and 1 • -2 and 2 http://numericalmethods.eng.usf.edu Transforming Numerical Methods Education for the STEM Undergraduate
The correlation coefficient varies between • -1 and 1 • 0 and 1 • -2 and 2 http://numericalmethods.eng.usf.edu Transforming Numerical Methods Education for the STEM Undergraduate
If the coefficient of determination is 0.25, and the straight line regression model is y=2-0.81x, the correlation coefficient is • -0.25 • -0.50 • 0.00 • 0.25 • 0.50 http://numericalmethods.eng.usf.edu Transforming Numerical Methods Education for the STEM Undergraduate
If the coefficient of determination is 0.25, and the straight line regression model is y=2-0.81x, the strength of the correlation is • Very strong • Strong • Moderate • Weak • Very Weak http://numericalmethods.eng.usf.edu Transforming Numerical Methods Education for the STEM Undergraduate
If the coefficient of determination for a regression line is 0.81, then the percentage amount of the original uncertainty in the data explained by the regression model is • 9 • 19 • 81 http://numericalmethods.eng.usf.edu Transforming Numerical Methods Education for the STEM Undergraduate
The percentage of scaled residuals expected to be in the domain [-2,2] for an adequate regression model is • 85 • 90 • 95 • 100 http://numericalmethods.eng.usf.edu Transforming Numerical Methods Education for the STEM Undergraduate