Download
1 / 29
300 likes | 475 Vues
Spectral contrast enhancement. Mirza Muhammad Waqar Contact: mirza.waqar@ist.edu.pk +92-21-34650765-79 EXT:2257. RG610. Course: Introduction to RS & DIP. Contents. Geographical Information System Remote Sensing & Satellite Image Processing Color Space Landsat 7 spectral bands

E N D
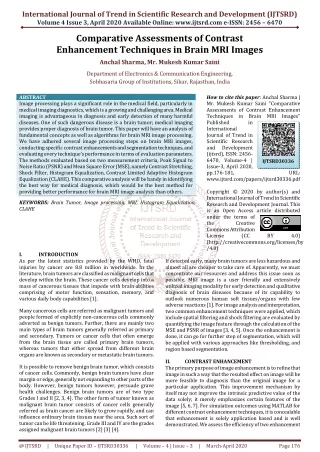
Spectral contrast enhancement Mirza Muhammad Waqar Contact: mirza.waqar@ist.edu.pk +92-21-34650765-79 EXT:2257 RG610 Course: Introduction to RS & DIP
Contents • Geographical Information System • Remote Sensing & Satellite Image Processing • Color Space • Landsat 7 spectral bands • Spectral Reflectance Curves • Image Interpretation • Spectral Ratioing • Indices
Overview • One of the strength of image processing is that it gives us the ability • To enhance the view of an area by manipulating the pixels value. • Contrast enhancement does not change the values in the image rather simply adjust the colors associated with these color values.
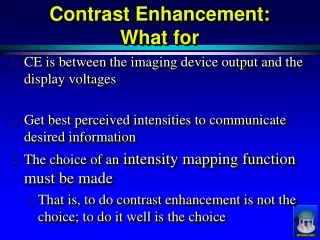
Image Enhancement • The alteration of the appearance of an image in such a way that the info contained in that image is more readily interpreted visually in terms of a particular need • It alters the visual impact of the image to improves the info contents for the interpreter • These operations improve the interpretability of an image by changing the contrast between the features in the scene • To improve the appearance of an image for human visual analysis
Image Enhancement • No single standard method can be said to be the best, it depends upon the need of the user • The characteristic of each image in terms of distribution of pixel values over 0-255 range will change from one area to another , thus enhancement tech suited for one image may not be good for other image covering different type of area
Image Histogram • Histogram greatly helps to deduce the appearance of an image • In a dark image, the gray levels would be clustered towards the lower end • In a uniformly bright image, the gray levels would be clustered towards the upper end • In a well contrasted image, the gray levels would be well spread out over much of the range
Image Enhancement • Methods of improving visual interpretability of an image • By altering the contrast of an image ( contrast stretching) • Converting from black and white to color representation • Contrast is simply the range and the distribution of the pixel values over the 0-255 gray scale
Conversion to color is desirable as the eye is more sensitive to variations in hue than change in the brightness Perception of Colors
Contrast Enhancement/ Stretching • Sensors record reflected or emitted radiant flux exiting from earth surface materials • Ideally one material would reflect tremendous amount of energy in a certain wavelength while another much less in the same wavelength • This would result in contrast between the two types of materials • In some cases different materials would often reflect similar amount of radiant flux throughout the visible and IR portion of EM spectrum resulting in a relatively low contrast image
Contrast Enhancement • Sensor on board have to be capable of detecting upwelling radiance levels ranging from low (from oceans) to very high (over snow) • For particular area to be imaged ,it is unlikely that full dynamic range of the sensor will be used ,thus the corresponding image is dull or over bright-over or under exposed
Why we need Contrast Enhancement • Quite often the useful data in a digital image populate only a small portion of available range of digital values. • Commonly 8 bit or 256 levels • Contrast enhancement involves changing the original values so that more of the available range is used. • It increases the contrast among the features and their background.
Types of Contrast Enhancement • Histogram Equalization Stretch • Standard Deviation Stretch • Gaussian Stretch • Gamma Correction • Level Slice • Constant Value • Invert Stretch • Percentage LUT • Piecewise Linear Contrast Stretch • Linear Stretch • Logarithm Stretch
Linear Contrast Enhancement • This technique involves the translation of the image pixel values from the observed range of digital number to the full range of the display device (e.g. 8 bit)
LINEAR STRETCH-MIN MAX The uniform expansion of the of input digital numbers to full range )-255) is called linear stretch BV OUT=255(BV IN-MIN) / (MAX-MIN) MIN=25, MAX=225
Histogram Equalization Stretch • This stretch assign more display values (range) to the frequently occurring portion of the histogram. • In this way, the detail in those areas will be better enhanced having high frequency relative to those areas having low frequency value in the histogram.
Histogram Conversion • The histogram of the original image is converted to other types of histograms as specified by user • Histogram Stretch- Image values are assigned to the display levels on the basis of their frequency of occurrence • More display values ( more radiometric details) are assigned to the frequently occurring portion of histogram • Special Stretch- To analyze specific features in greater radiometric detail s by assigning the display range exclusively to a particular range of image values
Histogram Equalization After Before
Standard Deviation Stretch • Standard deviation stretch trim all pixels that have a digital number beyond the range the defined standard deviation; • Then perform the linear stretch for the remaining pixels • Standard Deviation 1: 67 % • Standard Deviation 2: 95 % • Standard Deviation 3: 99 %
Gaussian Stretch • This histogram involve the fitting of the observed histogram to normal or Gaussian histogram. • This stretch adjust the range of lookup table values so that the output histogram is approximately a normal distribution.
Level Slice Stretch • It will slice the input image into user defined number of classes. • The output image will have only limited number of variations depending upon the user defined number of classes.
Density/ Level Slicing • Representation of a range of contiguous gray levels of gray scale image by a single color • Used to separate the data into “n” intervals or “slices” based on the histogram from one wavelength band. • All data within a slice are displayed as one digital number or color in the output image • The Gray level in the output image corresponds to the number of slices • Used frequently with thermal images, i.e. different temperature ranges can be shown with different slices
Level Slicing After Before
Invert Contrast Stretch • This contrast enhancement technique invert the current lookup table values. • This has the effect of producing a photographic negative of the image. • This technique is often used to extract information from the shadow.
Gray-Level Thresholding • Used to “segment "an input image into two classes. • Purpose is to develop a binary mask for one category, so that processing can be applied to each class independently Original NIRImage Set threshold here Mask Image for Water
Contrast Enhancement • If the range of gray levels could be altered so as to fit the full range of the black and white axis, then the contrast between the dark and bright areas of the image would be improved • Does not modify the original data unless new file is saved