Digital Measures Replacement
Digital Measures Replacement. Current Systems. UB uses two separate faculty annual report systems eCV School of Medicine School of Dentistry Activity Insight (Digital Measures) All other units. Issues with Reporting Systems.

Digital Measures Replacement
E N D
Presentation Transcript
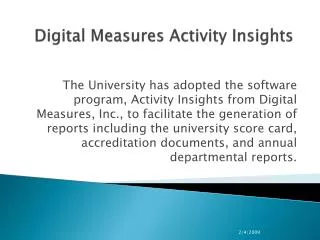
Current Systems • UB uses two separate faculty annual report systems • eCV • School of Medicine • School of Dentistry • Activity Insight (Digital Measures) • All other units
Issues with Reporting Systems • eCV written in Visual Fox Pro; Microsoft plans to discontinue support • Digital Measures interface poorly designed • No ability to automatically load publication data • No ability to automatically load grants & contracts data • Aggregated data reports for Deans and Chairs not available
Alternatives Considered • Improve Digital Measures • Not viable option (proprietary software) • Rewrite eCV • Indiana FAR considered better in-house solution • Indiana U. Faculty Annual Report (FAR) • Thompson Reuters Research in View • Live demo – Nov 10th • 11:30-1:00 Faculty and Department Administrator Session -- session will focus on the annual report part • 2:00-3:30 Session for Upper Level Administrators, Interested IT Staff, Library Administrators, Deans, OIA Staff, etc
Indiana FAR • Java based - - built on the Kuali framework • Access to source code – free • Total cost of ownership to consider • Faculty Annual Reports • Simple, easy-to-use interface • No real analysis capability, wasn’t designed for that • Customizable (we can modify the code) • Tie in to existing University data sources • Courses • Grants (we need extract from our own systems) • Ingest publications automatically (not now but maybe can be added)
Publications • Can cut and paste info • Could likely import current faculty data from DM
Research in View • Thompson – Reuters • Hosted Solution • Minimal faculty input • Much more than a Faculty Annual Report Tool • Analysis tool for all levels of university • InCites included • Annual license fee
Faculty profile data sources Thomson Reuters data sources minimize manual input from faculty Integration with your current systems via APIs
Faculty profile features • Regular alerts for new articles, grants, and patents matched to profile • Tools to verify and add data to profile by user or proxy • Settings to regulate sharing of profile data • Data export to CV, Reports, ResearcherID, and InCites • University data sources are used to define the list of active faculty and staff
Faculty members can quickly generate documents Choose a document template or choose specific activities and years to create a custom document .
Dashboards synthesize data for evaluation decisions Instant overviews of departments or individuals • Detailed views of all activities • E.g. Funded Grants: • How has funding for this department changed over time? • Where is the funding coming from? • Are collaborators involved? • How does funding for this department compare with other departments?
Department comparison reports Conduct inter-department comparisons across all activity areas
Group Reports (strategic strengths) Run group reports to compare activities across faculty members
Comparison Across Institutions • InCites is a web-based research evaluation tool designed to track trends on the field, country, and institution level, to enable detailed bibliometric analysis and reporting on the publications important to you.
Measure program strength within UB Citation impact in Physics has risen and fallen dramatically in recent years Relative Impact : Citation impact normalized for field average citation rate (= 1.0)