Theory Building (hypotheses testing)
110 likes | 349 Vues
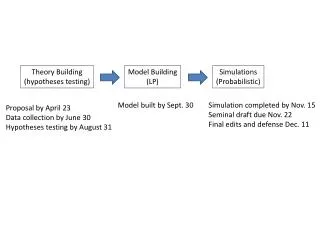
Theory Building (hypotheses testing). Model Building (LP). Simulations (Probabilistic). Model built by Sept. 30. Simulation completed by Nov. 15 Seminal draft due Nov. 22 Final edits and defense Dec. 11. Proposal by April 23 Data collection by June 30 Hypotheses testing by August 31.

Theory Building (hypotheses testing)
E N D
Presentation Transcript
Theory Building (hypotheses testing) Model Building (LP) Simulations (Probabilistic) Model built by Sept. 30 Simulation completed by Nov. 15 Seminal draft due Nov. 22 Final edits and defense Dec. 11 Proposal by April 23 Data collection by June 30 Hypotheses testing by August 31
Experimental Design Group 1 Group 2 Airline ticket purchase (time cost $0.50) Airline ticket purchase (time cost $0.50) Reliability (re-test) Rotate 50% in each group to cancel learning effect. Rotate 50% in each group to cancel learning effect. Foraging costs manipulation Generalizability Car rental purchase (time cost $0.50) Airline ticket purchase (time cost $1.00)
Cognitive absorption (CA) Temporal Dissociation (TD) Focused Immersion (FI) Heightened Enjoyment (HE) Control (CD) Curiosity (CU) Cognitive HCI factors Demographical HCI factors H5: a, b Age Gender Education Perceived Usefulness based on previous experience H6: a Patch Exhaustion (se) Access order Foraging time H6: b,c Time to Review (tr) H8: a,b H7: a,b,c, d,e,f Site Time to Access (ta) H1: a,b,c, d,e Time to Orient (to) Time to Enter (te) Time to Search (tf) H12: a,b H9: a,b Propensity to Explore (e) Surrender / Acquisition (sa) H2: a, b Foraging Surplus (s) Cognitive Playfulness (CPS) Time to Acquire (tz) H10: a,b Personal Innovativeness (PIIT) Information Load Usage Consolidation (uc) H3: a,b,c H4 Number of patches (p) H11: a,b Computer Self-Efficacy (CSE) Number of items (q)
HYPOTHESES 1: a,b,c,d,e Made up data Error rates in model (FIND time can be removed)
HYPOTHESES 2: a Number of events (one observation per site). In this example, more people abandoned the site when prices were higher than best available in market. The differences are in fact so high, that it could not be due to randomness in the sample.
HYPOTHESES 2: a,b Number of events (one observation per site). There could be many for each forager In this example there is sufficient evidence to suggest that the participants correctly surrenders when the foraging surplus is decreasing. I.e. the time to forage is not offset by better prices and sites are correctly abandoned.
HYPOTHESES 3: a,b,c Using the SPSS Levenberg-Marquardt non-linear regression modeling (LSE method) with adjusted r-squared and 95% confidence (F), our non-linear model has an r-square of 0.9245 In this SPSS example we see that if the number of items returned for a given search exceeds 75 or less than 25 there is more than 50% chance of site abandonment.
HYPOTHESES 5: a,b Spearman correlation coefficients and t-test of significance
HYPOTHESES 6: a,b,c Example is for 6a. Hypothesis 6b will follow same logic with order of access correlated with total time spend at a site. Hypothesis 6c follows same logic, with order of access correlated with total time spend on reviewing items provided at a site. Spearman correlation coefficients and t-test of significance