Chapter 2 Polynomial, Power, and Rational Functions
1.65k likes | 1.92k Vues
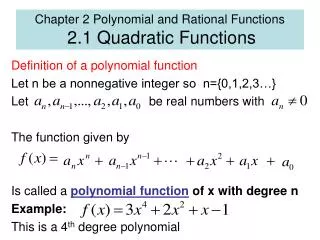
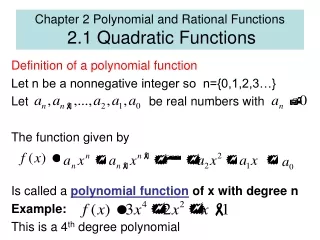
Chapter 2 Polynomial, Power, and Rational Functions. Group Practice. Polynomial Function. Note:. Remember Polynomial Poly = many Nomial = terms So it literally means “many terms”. Name Form Degree Zero Function f(x)=0 Undefined Constant Function f(x)=a ( a ≠0) 0

Chapter 2 Polynomial, Power, and Rational Functions
E N D
Presentation Transcript
Note: • Remember Polynomial • Poly = many • Nomial= terms • So it literally means “many terms”
Name Form Degree Zero Function f(x)=0 Undefined Constant Function f(x)=a (a≠0) 0 Linear Function f(x)=ax+b(a≠0) 1 Quadratic Function f(x)=ax2+bx+c(a≠0) 2
Remember • The highest power (or highest degree) tells you what kind of a function it is.
Example #1 • Which of the follow is a function? If so, what kind of a function is it? • A) • B) • C) • D) • E)
Average Rate of Change (slope) Rate of change is used in calculus. It can be expressing miles per hour, dollars per year, or even rise over run.
Answer • Use point-slope form • (-1,2) (2,3) • Y-3=(1/3)(x-2)
Ultimate problem • In Mr. Liu’s dream, he purchased a 2014 Nissan GT-R Track Edition for $120,000. The car depreciates on average of $8,000 a year. 1)What is the rate of change? 2)Write an equation to represent this situation 3) In how many years will the car be worth nothing?
Answer 1) -8000 2) y=price of car, x=years y 3) When the car is worth nothing y=0 X=15, so in 15 years, the car will be worth nothing.
Ultimate problem do it in your group (based on 2011 study) • When you graduate from high school, the starting median pay is $33,176. If you pursue a professional degree (usually you have to be in school for 12 years after high school), your starting median pay is $86,580. • 1) Write an equation of a line relating median income to years in school. • 2) If you decide to pursue a bachelor’s degree (4 years after high school), what is your potential starting median income?
Answer • 1) y=median income, x=years in school Equation: y= 4450.33x+33176 2) Since x=4, y=50,977.32 My potential median income is $50,977.32 after 4 years of school.
Characterizing the Nature of a Linear Function Point of ViewCharacterization Verbal polynomial of degree 1 Algebraic f(x) = mx + b (m≠0) Graphical slant line with slope m and y-intercept b Analytical function with constant nonzero rate of change m: f is increasing if m>0, decreasing if m<0; initial value of the function = f(0) = b
Linear Correlation • When you have a scatter plot, you can see what kind of a relationship the dots have. • Linear correlation is when points of a scatter plot are clustered along a line.
Properties of the Correlation Coefficient, r • -1 ≤ r ≤ 1 • When r > 0, there is a positive linear correlation. • When r < 0, there is a negative linear correlation. • When |r| ≈ 1, there is a strong linear correlation. • When |r| ≈ 0, there is weak or no linear correlation.
Regression Analysis • Enter and plot the data (scatter plot). • Find the regression model that fits the problem situation. • Superimpose the graph of the regression model on the scatter plot, and observe the fit. • Use the regression model to make the predictions called for in the problem.
Group Work: plot this with a calculator. Example of Regression
Answer • Horizontal shift right 2 • Vertical shift up 3 • Vertical stretch by a factor of 2 or horizontal shrink by a factor of 1/2
Group Work • Describe the transformation
Answer • Horizontal shift left 4 • Vertical shift up 6 • Vertical stretch by a factor of 3/2 or horizontal shrink by a factor of 2/3 • reflect over the x-axis
Vertex Form of a Quadratic Equation Any quadratic function f(x) = ax2 + bx + c, a≠0, can be written in the vertex form f(x) = a(x – h)2 + k The graph of f is a parabola with vertex (h,k) and axis x = h, where h = -b/(2a) and k = c – ah2. If a>0, the parabola opens upward, and if a<0, it opens downward.
Answer • (-4,6) • (1,-3)
Example: Use completing the square to make it into vertex form
Group Work • Change this quadratic to vertex form
Characterizing the Nature of a Quadratic Function Point of ViewCharacterization
Example • You are in MESA and we are doing bottle rockets. You launched your rocket and its’ total time is 8.95 seconds. Find out how high your rocket went (in meters) Flyin’ High
Answer • You first have to figure out how fast your rocket is when launched. Remember the velocity at the max is 0. Also the time to rise to the peak is one-half the total time. • So 8.96/2 = 4.48s
Homework Practice • Pg 182-184 #1-12, 45-50 • Pgs 182-184 #14-44e, 55, 58,61
Power Function Any function that can be written in the form f(x) = k·xa, where k and a are nonzero constants, is a power function. The constant a is the power, and the k is the constant of variation, or constant of proportion. We say f(x) varies as the ath power of x, or f(x) is proportional to the ath power of x.
Group Work: Answer the following with these two functions • Power: • Constant of variation: • Domain: • Range: • Continuous: • Increase/decrease: • Symmetric: • Boundedness: • Max/min: • Asymptotes: • End behavior:
Monomial Function Any function that can be written as f(x) = k or f(x) = k·xn, where k is a constant and n is a positive integer, is a monomial function.
Note: • Remember, it is important to know the parent functions. Everything else is just a transformation from it. • Parent functions can be found in chapter 1 notes.
Group Talk: • What are the characteristics of “even functions”? • What are the characteristics of “odd functions”? • What happen to the graphs when denominator is undefined? • Clue: Look at all the parent functions.
Graphs of Power Functions For any power function f(x) = k·xa, one of the following three things happens when x < 0. • f is undefined for x < 0. • f is an even function. • f is an odd function.