Download
1 / 23
250 likes | 538 Vues
ESTIMATING THE INFLUENCE OF SURFACE CHARACTERISTICS OF ROCK JOINTS ON SHEAR BEHAVIOR. Y.Tasaku, Y.Jiang, Y.Tanahashi, B.Li. Graduate school of Science and Technology, Nagasaki University. Introduction. The development of deep underground space has received high attention.

E N D
ESTIMATING THE INFLUENCE OF SURFACE CHARACTERISTICS OF ROCK JOINTS ON SHEAR BEHAVIOR Y.Tasaku, Y.Jiang, Y.Tanahashi, B.Li Graduate school of Science and Technology, Nagasaki University
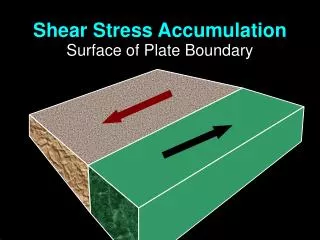
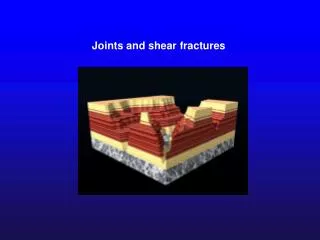
Introduction The development of deep underground space has received high attention The deformation behavior and stability of underground structures depend principally on the shear strength of discontinuities in rock masses. The shear strength is generally dominated by surface characteristics of rock joints. Direct shear test Measurement and evaluation of joint surface ・ The dependency of mechanical behavior on boundary conditions. ・ The relationship between the mechanical behavior and the surface characteristics are evaluated.
Constant normal load condition Free σn=Constant τ Rock slope (non- reinforcement) Constant normal load (CNL) condition
Joint Joint Constant normal stiffness (CNS) condition σn≠Constant τ Constant normal stiffness (CNS) condition Deep underground Constraint from rock masses Change of normal stress
Digital-controlled shear test apparatus Vertical Jack Specimen Horizontal Jack
Structure of surface measurement system Laser displacement meter X-Y positioning table Computer for control and record
Specimen ・Dimension (mm) 200×100×100 Natural surfaces ・Mix ratio(weight ratio) plaster:water:retardant =1:0.2:0.005 ・Unconfinedcompressive strength σn0=32.0MPa (middle hard rock) Possible to analyze the substantial fractal dimension
Test cases J2 J1 (Large asperity in the center and smooth surface) (Many small asperities) J3 (Specimen of previous study with very smooth surface)
Test cases ・Control condition Constant normal load (CNL) condition and constant normal stiffness (CNS) condition ・Initial normal stress σn0: 1MPa, 2MPa (50~100m), 5MPa (about 250m) ・Normal stiffness: kn J1 is 1GPa/m and 7GPa/m J2 is 1GPa/m and 3GPa/m, Each of J1 and J2 has 9 cases; 18 cases at all
Result of shear test (J1,σn0=2MPa) CNL condition CNS condition(kn=3GPa/m) CNS condition(kn=7GPa/m)
Surface of specimen before and after shear (J1,σn0=2MPa) (mm) Before shear After shear on CNS condition ( kn=3GPa/m) After shear on CNL condition
Evaluation method of surface roughness by projective covering method Projective covering cell Fracture surface AT(δ): Total area AT0(δ): Apparent area (2<Ds<3) δ : length of a mesh
Transition of fractal dimension CNL J2 CNS(kn=1GPa/m) CNS(kn=3GPa/m) Before shearing
Statistical parameter of two dimensions Z2 is the average slope of asperity N: Total number of measuring points along the profiles yi: ith value of height ⊿x:Minute distance to direction x
Transition of Z2 CNL Before shearing CNS(kn=3GPa/m) J2 CNS(kn=7GPa/m)
Maximum shear stress Maximum shear stress: (Barton、1977) τ:Maximum shear stress σn0:Initial normal stress JRC: Joint roughness coefficient JCS:Joint wall compressive strength φb:Inter friction of joint Two dimensional indicator Actual rock joint is three dimensional Suggestion equation ‘a’ and ‘b’ are obtained from the relationship between JRC and Ds on experience.
Comparison of the Barton’s empirical equation with proposed equation Barton’s empirical equation Base line Proposed equation Proposed equation
Conclusion Influence • Constraint from rock blocks • Surface characteristics of joint • The relation of Initial normal stress and surface roughness(about CNL) Shear behavior of rock joint Proposed equation Confirmation of validity It is possible to predict the shear behavior byDs
自然の岩石を供試体として用いる 圧裂試験 Dsを用いて、せん断特性を正確に予測 表面のケースの充実
Dsとピークせん断応力との関係 破線:理論値 表面2(Ds=2.0279) 表面1(Ds=2.0235) 表面3(Ds=2.008)
JRC値とZ2 JRC値は以下の式(Tse、1979)
CNS制御(kn=3GPa/m) CNL制御 表面1 表面2 せん断応力の比較(σno=2MPa) 表面1 表面2