Download
1 / 26
260 likes | 445 Vues
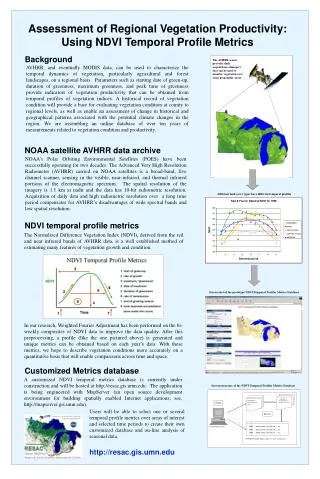
PN-43. Study Forest Degradation in Kalimantan using NDVI SPOT Vegetation. Suharto Widjojo and Mulyanto Darmawan. Introduction Study Area Method of Analysis Result and Discussion Conclusion. Introduction

E N D
PN-43 Study Forest Degradation in Kalimantan using NDVI SPOT Vegetation Suharto Widjojo and MulyantoDarmawan
Introduction Study Area Method of Analysis Result and Discussion Conclusion
Introduction Over the past two decade, satellite data become important in managing natural resources, studying environmental change and the earth’s land cover mapping. Remote sensing technology may become an effective and helpful tool to monitor forest area. However, remote sensing data are not easily interpreted in tropical rain forest due to spectral diversity and complex pattern within tree layer of forest and the cloud conditions that hampering the application of remote sensing. Therefore conventional classification method based on multivariate classification of pixel often produces inadequate results of landcover map to resolve forest discrimination. Several classification techniques have been develop to map cover of tropical rain forest ranging from fine to coarse resolution data A visual interpretation was also found as an effective method to overcome problem in tropical rain forest area
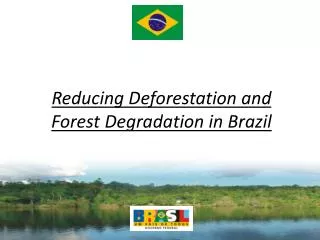
Basically deforestation or forest lost can be monitored through remote sensing, however forest degradation is more complex and ambiguous. It is difficult to derive variable or indicator of forest degradation from remotely sensed data without intensive measurement in the field. Many researchers had considered that forest degradation is similar to deforestation (e.g. Shimabukuro et al.1998). They defined a simple definition of deforestation as “conversion of forest”. However, when such definition applied much forest agency would create large area of forest degradation. This study has elaborated FAO definition for forest degradation as “changes within the forest, which negatively affect the structure of function of forest or site, and thereby lower the capacity to supply product or service” (FA0 2001). As various shape and size of forest, known as geometrical shape, were produced as the aftermath of land conversion in Kalimantan, measuring the remaining forest as result of the deforestation does not give a complete picture of forest degradation. The geometrical shape (shape and size) of forest has been applied for ecological landscape study or for landcover mapping
In recent year, vegetation phenology has found new relevance within global climate change researches, especially with increasing popularity and availability of global satellite. Therefore in this study the geometrical shape measured from phenological analysis were evaluated to understand forest degradation in Kalimantan forest.
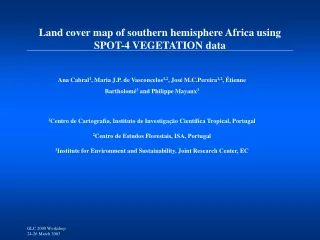
Study Area Study area is located in the island of Borneo, a large island in the Indo-Malay region. This region known as one of the largest tropical rain forest in the world next to American rain forest centered on the Amazon basin. The island is located in the equator, experience high temperature and humidity all year. Eastern to southern part, the hill like lowland and wetland extend widely and cover about 55% of the island. In center part barrier with mountain of 1000-2000 m above mean sea level cover about 5-10% of the island. In the north volcanic rock observed with mount Kinabalu as the highest place at about 4000 m above mean sea level, cover about 3-5% of the island.
Method of Analysis Daily SPOT Vegetation covering all Indonesia were acquired for periods of April 1998 to August 2001, and then the Normalized Difference Vegetation Index (NDVI) 10 days composite was calculated from ratio of (infrared – red) and (infrared+ red) channel. This procedure produced total 123 scene of NDVI with size 2.913 and 3.473 for column and line per scene, respectively. A local maximum of Kaufman filter was applied to NDVI 10 days composite. Phenology refers to the development, differentiation and initiation organ (Hodges 1991). According to Lieth (1974) phenology is the study of the timing of recurring biological events, the cause of their timing with regard to biotic and a biotic forces, and the interrelation among phases of the same or different species. Observation of phenological variable had intensively developed by several researchers (e.g. Llyod 1990, Defries and Twonshend 1994, Moulin et al. 1997 and Kang et al. 2003). Some variable may not necessary correspond directly to conventional (ground based phenological event) but could provide indicators of ecosystem dynamic.
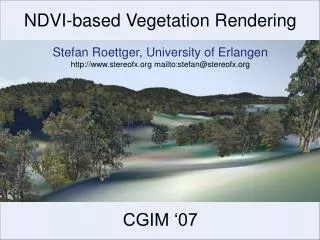
Nine phenological variable were determined from NDVI as follow minimum NDVI (Min), Maximum NDVI (Max), NDVI Amplitude (AMP), Duration of greenness (DUR), Start of (Onset)and end of growing season (End), the rate of green up (RtUp) and green down (RtDn) and total of integrated NDVI (TIN). List of phenological variable description and illustration graphic are listed in Table 1 and graphic 1.
Table 1. List of Phenological variable calculated in this study
Figure 1. Phenological variable from NDVI interpreted from remotely sensed data
Unsupervised classification using K mean method was applied to phenological variables and seven associated classes of landcover type were determined as follow: Inner water, open land, agriculture or sparsely vegetation, mix lowland and peats swamp forest, mix lowland and upland dense forest, mix lowland and other secondary forest, and other vegetation non forest. The result showed average accuracy assessment for overall accuracy more than 70% and Khat statistic more than 60%.
As forest degradation is become concerned the ratio of forest to non forest (Pof) and connectivity of forest with other non forest (Cof) were calculated with Knowledge base expert system (KBES) method. The Pof represents the number of forest pixel in the windows proportional to the number of pixels in the windows excluding water. While the Cof represents the number of pair pixel where both are forest in proportion with the number of pair pixels with at least one is forest pixel. List of classification category is shown in Table 2 and the calculation of Pof and Cof in 5x5 windows below:
Result and Discussion Result of measuring some phenological variable from satellite data is shown in table 3. It was found that forest has high value of Max, Min, Onset, End and TIN which associated with high level of photosynthesis activity compared to landcover of non forest or bare land. There are considerable difficult to interpret phenological variable among other type of forest but It was found that Onset and End value, which represent length of growing season, of natural upland forest (mainly consist of mountain and lower mountain forest) higher than the Onset and end value of secondary forest (e.g. forest after logging) and lowland forest (e.g. peat swamp forest, mangrove and swamp forest).
Table 3. Phenological variable measured from NDVI for landcover type in study area
The critical point in phenological analysis method is determining Onset and the End. After these variables were determined, the other variables were easily calculated. Various threshold values estimated from spectral pattern, including the mean value to determine Onset and End had been tested in this research and found does not produce satisfactory result for classification. The accuracy was less than 50% for booth overall accuracy and kappa statistic. Therefore the variable Onset and End variable were determined by indentifying the sudden increase of NDVI value in time series data that may be a signal of growing season. To identify as sudden increase in NDVI, the moving average method was applied. The real NDVI was compared to the moving average value. The Onset and End were determined when the real NDVI meet the moving average data in upward (Onset) and downward (End) direction. The calculation of moving average to 10 days composite data is given in the following formula:
Where is the moving average for time d, Xd is corrected NDVI for time d, and t is moving average time interval (this study used 30 days as the time interval). Separating forest and non forest are quite reasonable using phenological analysis. The regular sampling point with 1,000 m interval over three selected area to verify the accuracy assessment of derived landcover from phenological variable is shown in Table 5 and Figure 2. The highest accuracy of forest class obtained in error matrix was about 90% for user’s accuracy and 80% for producer’s accuracy.
Where is the moving average for time d, Xd is corrected NDVI for time d, and t is moving average time interval (this study used 30 days as the time interval). Separating forest and non forest are quite reasonable using phenological analysis. The regular sampling point with 1,000 m interval over three selected area to verify the accuracy assessment of derived landcover from phenological variable is shown in Table 5 and Figure 2. The highest accuracy of forest class obtained in error matrix was about 90% for user’s accuracy and 80% for producer’s accuracy.
Table 5. The Accuracy Assessment of landcover derived from phenological analysis tested over three locations Figure 2. Landcover map derived from phenological data and three site locations for accuracy assessment
Characteristic of forest measured from phenological analysis on 10 days composite NDVI SPOT are listed in Table 4 and Figure 3. It is predicted that about 46% of Kalimantan has been threatened with forest clearance, while natural forest cover about 53% of Kalimantan area. Of the 53% of the natural forest, actually only 45% was characterized as interior forest, which might represent the remaining nature of tropical rain forest as result of long land conversion in Kalimantan or Borneo island. While the rest of 55% has been characterized as forest degradation, which related to transitional forest, perforated and edge forest at about 8.49%, 9.08% and 37.19% respectively. In addition, of 46% of forest clearance about 57% was due to conversion to plantation or agriculture and 43% become patch forest.
Table 4. Characteristic of forest measured from phenological analysis
One important think on this research is to develop a forest degradation model over Kalimantan Island. By corresponding geometrical shape of forest and characteristic of landcover change over study area, the characteristic of forest degradation in Kalimantan forest was interpreted as illustrated at Figure 4.
Interior Patch Geometrical Shape of Forest Edge Perforated Stable forest Forest Re-growth Forest Clearance Stable Non forest Charateristic of Land cover change pattern Interior Patch Geometrical Shape of Forest Edge Perforated Low High Forest degradation level Non Forest Figure 4. The geometrical shape of forest and the historical land cover change pattern relationship and it’s corresponding to level of forest degradation Non Forest
Conclusion This study demonstrated the utilization of multi temporal satellite data for assessment of forest degradation by using phenological analysis and geometrical shape methods. Understanding of this phenological pattern through NDVI will help in developing method for detection on forest degradation. It was found that forest degradation over Kalimantan tropical rain forest was predicted at about 55% of total remaining forest available. Of this 55% of forest degradation, it was characterized as transition forest, perforated and edge forest. These three types of geometrical shape of forest threaten with change within forest.