Enhancing Ocean Data Access and Ecosystem Modeling through Collaborative Approaches
This presentation focuses on the integration of diverse ocean data sources, including moorings, ship surveys, drifters, AUV runs, and ROV CTD observations. Led by experts like Fei Chai and featuring contributions from numerous participants, it explores key metrics such as surface salinity, temperature, nitrate, and chlorophyll levels. The discussion emphasizes the need for improved data access, visualization, and collaborative modeling efforts to provide accurate ecosystem assessments. Despite funding challenges, there are opportunities to automate and enhance data use for future research.

Enhancing Ocean Data Access and Ecosystem Modeling through Collaborative Approaches
E N D
Presentation Transcript
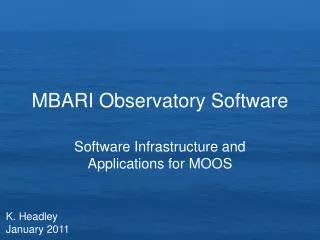
MBARI Observations Plus • Moorings • Ship surveys • Drifters • AUV runs • The hidden data – ROV CTD • ROMS ecosystem modeling-Fei Chai • End with a gee whiz animation-Mike McCann • Seth Bushinsky, Gernot Friederich, Dorota Kolber, Lionel Pawlowski, Tim Pennington (and other ship participants), Martin Suro
AOSN II – I SST MB06-1 Surface salinity
AOSN II – I Surface nitrate MB06-1 Surface chlorophyll
AOSN II – 3 SST MB06-2 Surface salinity
AOSN II – 3 Surface nitrate MB06-2 Surface chlorophyll
MB06 -1 Temperature MB06 -2
MB06 -1 Salinity MB06 -2
AUV Ecosystem model Difference
What next? • Not sure since analysis not really funded • Data is available for use • Can and should automate/improve data/model access/visualization • Modelers need to move from competitive to collaborative environment and provide tools for accurate model estimates of fluxes