Download
1 / 48
480 likes | 587 Vues
This analysis explores the relationship between global climate change and its regional impacts on water resources, particularly focusing on the adequacy of current drainage structures. Evidence, including rising atmospheric carbon dioxide and predictions for stream flows and nutrient loss, is reviewed. Findings highlight changes such as increased precipitation intensity, a longer growing season, and greater flood risks in the US Midwest. The study emphasizes the need for improved infrastructure to accommodate these shifts and ensure sustainable management of water resources in a warming climate.

E N D
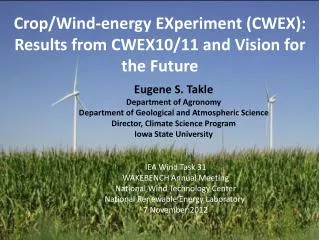
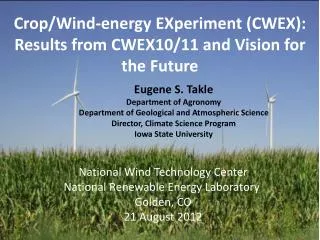
Global Climate Change and Regional Impacts:Are We Building the Right Kind of Drainage Structures to Handle Climate Change? Eugene S. Takle Agronomy Department Geological and Atmospheric Science Department Iowa State University Ames, Iowa 50011 gstakle@iastate.edu
Outline • Evidence for global climate change • Future atmospheric carbon dioxide concentrations • Simulations of global climate and future climate change • Implications for stream flow and nutrient loss • Summary
2040 Carbon Dioxide and Temperature 2004
Carbon Dioxide and Temperature Stabilization at 550 ppm
Carbon Dioxide and Temperature “Business as Usual” (fossil intensive) 2100 ?
Associated Climate Changes • Global sea-level has increased 1-2 mm/yr • Duration of ice cover of rivers and lakes decreased by 2 weeks in N. Hemisphere • Arctic ice has thinned substantially, decreased in extent by 10-15% • Reduced permafrost in polar, sub-polar, mountainous regions • Growing season lengthened by 1-4 days in N. Hemisphere • Retreat of continental glaciers on all continents • Poleward shift of animal and plant ranges • Snow cover decreased by 10% • Earlier flowering dates • Coral reef bleaching Source: Intergovernmental Panel on Climate Change, 2001 Report
Mann, M. E., R. S. Bailey, and M. K. Hughes, 1999: Geophysical Research Letters 26, 759.
Source: IPCC, 2001: Climate Change 2001: The Scientific Basis
Source: IPCC, 2001: Climate Change 2001: The Scientific Basis
Observed summer (June-July-August) daily mean temperature changes (K) between 1976-2000 (Adapted from Folland et al. [2001]).
Source: Jerry Meehl, National Center for Atmospheric Research
The planet is committed to a warming over the next 50 years regardless of political decisions Source: National Center for Atmospheric Research
Amount of warming is in question, but all models project a warming Source: Intergovernmental Panel on Climate Change, 2001 Report
Climate Change Projected for 2100 Rapid Economic Growth Slower Economic Growth
IPCC Summary for Policy Makers • An increasing body of observations gives a collective picture of a warming world and other changes in the climate system • Emissions of greenhouse gases and aerosols due to human activities continue to alter the atmosphere in ways that are expected to affect the climate
IPCC Summary for Policy Makers, cont’d • Confidence in the ability of models to project future climate has increased • There is new and stronger evidence that most of the warming observed over the last 50 years is attributable to human activities
IPCC Summary for Policy Makers, cont’d • Anthropogenic climate change will persist for many centuries • Further action is required to address remaining gaps in information and understanding
Climate Surprises • Breakdown of the ocean thermohaline circulation (Greenland melt water) • Breakoff of the West Antarctic Ice Sheet
Regional Climate Change for the US Midwest • Observed and projected changes in climate • Impact on water quantity and water quality • Policy implications
Changes in Daily Maximum Temperature Projected for 2040 by a Regional Climate Model
Changes in Daily Minimum Temperature Projected for 2040 by a Regional Climate Model
“Warming Hole” ˚C DTmax (JJA)
For the Midwest • Warming will be greater for winter than summer • Warming will be greater at night than during the day • A 3oF rise in summer daytime temperature triples the probability of a heat wave • Growing season will be longer (8-9 days longer now than in 1950) • More precipitation • Likely more soil moisture in summer • More rain will come in intense rainfall events • Higher stream flow, more flooding
Sub-Basins of the Upper Mississippi River Basin 119 sub-basins Outflow measured at Grafton, IL Approximately one observing station per sub-basin Approximately one model grid point per sub-basin
Soil Water Assessment Tool (SWAT) • Long-term, continuous watershed simulation model (Arnold et al,1998) • Assesses impacts of climate and management on yields of water, sediment, and agricultural chemicals • Physically based, including hydrology, soil temperature, plant growth, nutrients, pesticides and land management • Daily time steps
Validation of SWAT: Annual Stream Flow at Grafton, IL
Validation of SWAT: Monthly Stream Flow at Grafton, IL
Ten-Year Mean Precipitation Generated by the RegCM2 Regional Climate Model Driven with HadCM2 Global Model Results for the Contemporary and Future Scenario (2040s) Climate
Ten-Year Mean Monthly Stream Flow Generated by the RegCM2 Regional Climate Model Driven with HadCM2 Global Model Results for the Contemporary and Future Scenario (2040s) Climate
Comparison of Simulated Stream Flow under Climate Change with Various Model Biases
Relation of Runoff to Precipitation for Various Climates
Regional Climate Modeling for Informing Policy on Water Quality • How does the combination of climate change and land use impact water quality? • Use nitrates and sediment as indicators • What alternative land management strategies will improve water quality? • What policies need to be implemented to achieve this water quality improvement?
Scenario 1: all Agriculture Scenario 2: all Forest
Scenario 3: N. half Agric. and S. half Forest. Scenario 4: S. half Agric. and N. half Forest.
Scenario 5: Upper half Agric. and lower half Forest. Scenario 6: Lower half Agric. and upper half Forest.
Scenario 7: Main channel basins - Agric. Scenario 8: Main channel basins - Forest.
Improving Regional Climate Models • Project to Intercompare Regional Climate Simulations • Transferability Working Group of GEWEX
Summary Regional climate models demonstrate sufficient skill to be useful for driving some climate impacts assessment models for the purpose of informing policy makers and decision-makers of vulnerabilities and opportunities associated with future climate change
For More Information • See my online Global Change course: http://www.meteor.iastate.edu/gccourse • Contact me directly: gstakle@iastate.edu