Download
1 / 1
10 likes | 101 Vues
Investigating plastic changes in humans with long-term unilateral hearing loss, focusing on auditory cortex symmetry alterations. Results show increased ipsilateral activation in PAC. Discussion on contralateral advantage reduction in unilateral hearing loss patients.

E N D
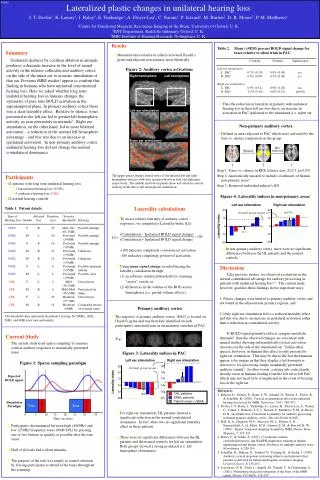
#1561 Lateralized plastic changes in unilateral hearing loss J. T. Devlin1, K. Lanary1, J. Raley1, E. Tunbridge1, A. Floyer-Lea1, C. Narain1, P. Jezzard1, M. Burton2, D. R. Moore3, P. M. Matthews1 1Centre for Functional Magnetic Resonance Imaging of the Brain, University of Oxford, U. K. 2ENT Department, Radcliffe Infirmary, Oxford, U. K. 3MRCInstitute of Hearing Research, Nottingham, U. K. Results Table 2. Mean (±SEM) percent BOLD signal change for tones relative to silent trials in PAC. Controls Patients Significance Left ear stimulation L. PAC 0.7% (0.10) 0.8% (0.08) n.s. R. PAC 0.5% (0.09) 0.5% (0.09) n.s. Right ear stimulation L. PAC 0.9% (13.4) 0.9% (0.20) n.s. R. PAC 0.3% (0.10) 0.6% (0.12) p<0.08 Summary • Monaural tones relative to silence activated Heschl’s gyrus and adjacent non-primary areas bilaterally Unilateral deafness by cochlear ablation in animals produces a dramatic increase in the level of neural activity in the inferior colliculus and auditory cortex on the side of the intact ear to acoustic stimulation of that ear. Previous fMRI studies1 appear to confirm this finding in humans who have unilateral sensorineural hearing loss. Here we asked whether long term unilateral hearing loss in humans changes the symmetry of pure tone BOLD activation in the supratemporal plane. In primary auditory cortex there was a clear laterality effect. Relative to silence, tones presented to the left ear led to greater left hemisphere activity, as seen previously in normals2. Right ear stimulation, on the other hand, led to more bilateral activation – a reduction of the normal left hemisphere advantage – and this was due to an increase in ipsilateral activation. In non-primary auditory cortex unilateral hearing loss did not change the normal contralateral dominance. Figure 2: Auditory cortex activations Right hemisphere Left hemisphere PreCS IPS CS CS PreCS IPS PreCS SMG IFS SMG PTr PT STG HG PT Insula PTr HG PP Insula STG PP STS STS MTG MTG • Thus the reduction in laterality in patients with unilateral hearing loss in their left ear was due to an increase in activation in PAC ipsilateral to the stimulated (i.e. right) ear. TP TP Left ear stimulation Non-primary auditory cortex • Defined as areas adjacent to PAC which were activated by the tone vs. silence comparison in the group 1 2 3 Step 1: Tones vs. silence in RFX (cluster stats: Z>2.3, p<0.05) Step 2: Anatomically masked to include coordinates of human non-primary areas4 Step 3: Removed individual subject’s HG Right ear stimulation HG removed Masked p<0.01 p<10-7 The upper panels display lateral views of the inflated left and right hemisphere surfaces with sulci and gyri shown in dark and light grey, respectively. The middle and bottom panels show activation in cortical auditory fields due to left and right ear stimulation. Participants • 11 patients with long term unilateral hearing loss • 7 sensorineural hearing loss (SNHL) • 5 conductive hearing loss (CHL) • 12 normal hearing controls Figure 4: Laterality indices in non-primary areas Left ear stimulation Right ear stimulation Laterality calculations Table 1. Patient details Type of Affected Duration Severity Hearing loss Gender Ear (yrs) (threshold) Etiology SNHL F R 23 Mod.-Sev. Possibly mumps (65-75dB) SNHL M L 20 Profound Possibly mumps (>90dB) SNHL F R 16 Profound Possibly mumps (>95dB) SNHL M R 12 Profound Unknown (>95dB) SNHL M R 12 Profound Unknown (>95dB) SNHL F L 9 Profound Possibly maternal (>95dB) rubella SNHL M L 8 Profound Possibly viral (>95dB) CHL F L 2 Mild Otosclerosis (36.25dB) CHL M R 6 Mild-Mod. Perforated ear (46.25dB) drum CHL F L 20 Moderate Otosclerosis (57.5dB) CHL M R 18 Moderate Congenital atresia (60dB) of external canal The threshold value represents the patient’s average for 500Hz, 1kHz, 2kHz, and 4kHz pure tone audiometry. 20 10 0 -10 -20 20 10 0 -10 -30 (p<0.05) Normal group means * • To assess relative laterality of auditory cortex responses, we computed a Laterality Index (LI): (Contralateral - Ipsilateral BOLD signal change) (Contralateral + Ispilateral BOLD signal change) +100 indicates completely contralateral activation -100 indicates completely ipsilateral activation • Using mean signal change avoided biasing the laterality calculation through (1) an arbitrary statistical threshold for counting “active” voxels, or (2) differences in the volume of the ROIs across hemispheres (i.e. partial volume effects). Laterality index (n.s.) × 100 LI = • In non-primary auditory cortex, there were no significant differences between the HL patients and the normal controls. Discussion Like previous studies, we observed a reduction in the normal contralateral advantage for auditory processing in patients with unilateral hearing loss1,5. The current study, however, qualifies these findings in two important ways: 1. Plastic changes were limited to primary auditory cortex and not found in the adjacent non-primary regions, and 2. Only right ear stimulation led to a reduced laterality effect and this was due to an increase in ipsilateral activation rather than a reduction in contralateral activity. If BOLD signal primarily reflects synaptic metabolic demands6, then the observed changes are consistent with animal studies showing substantial sub-cortical activation increases on the side of the stimulated ear. Unlike other species, however, in humans this effect is only present for right ear stimulation. This may be due to the fact that humans appear to be unique in that they display a left hemisphere dominance for processing simple monaurally presented auditory stimuli2. In other words, a strong sub-cortical path already exists in humans leading from the left ear to left PAC which may not need to be strengthened in the event of hearing loss in the right ear. Primary auditory cortex • The majority of primary auditory cortex (PAC) is located on Heschl’s gyrus and was therefore identified on each participant’s structural scan as an anatomic correlate of PAC. Current Study E.g.: • The current study used sparse sampling3 to measure cortical auditory responses to monaurally presented tones • Participants discriminated between high (4000Hz) and low (250Hz) frequency tones (90db SPL) by pressing one of two buttons as quickly as possible after the tone onset. • Half of all trials had a silent stimulus. • The purpose of the task was simply to control attention by forcing participants to attend to the tones throughout the scanning. Figure 3: Laterality indices in PAC Left ear stimulation Right ear stimulation Figure 1: Sparse sampling paradigm 50 30 10 -10 -30 -50 50 30 10 -10 -30 -50 Normal group means * Expected BOLD signal Laterality index R References 1. Bilecen, D., Seifritz, E., Radu, E. W., Schmid, N., Wetzel, S., Probst, R., & Scheffler, K. (2000). Cortical reorganization after acute unilateral hearing loss traced by fMRI. Neurology, 54(3), 765-767. 2. Devlin, J. T., Raley, J., Tunbridge, E., Lanary, K., Floyer-Lea, A., Narain, C., Cohen, I., Behrens, T. E. J., Jezzard, P., Matthews, P. M., & Moore, D. R. (in submission). Functional asymmetry for auditory processing in human primary auditory cortex. (See also Poster #1448.) 3. Hall, D. A., Haggard, M. P., Akeroyd, M. A., Palmer, A. R., Summerfield, A. Q., Elliot, M. R., Gurney, E. M., & Bowtell, R. W. (1999). "Sparse" temporal sampling in auditory fMRI. Human Brain Mapping, 7, 213-223. 4. Rivier, F., & Clarke, S. (1997). Cytochrome oxidase, acetylcholinesterase, and NADPH-diaphorase staining in human supratemporal and insular cortex: Evidence for multiple auditory areas. NeuroImage, 6, 288-304. 5. Scheffler, K., Bilecen, D., Schmid, N., Tschopp, K., & Seelig, J. (1998). Auditory cortical responses in hearing subjects and unliateral deaf patients as detected by functional magnetic resonance imaging. Cerebral Cortex, 8, 156-163. 6. Logothetis, N. K., Pauls, J., Augath, M., Trinath, T., & Oeltermann, A. (2001). Neurophysiological investigation of the basis of the fMRI signal. Nature, 412(6843), 150-157. n.s. CHL patients SNHL patients Patient mean (±SEM) Stimulation Paradigm Tone Tone Scanner Scanner • For right ear stimulation, HL patients showed a significant reduction in the normal contralateral dominance. In fact, there was no significant laterality effect in these patients. • There were no significant differences between the HL patients and the normal controls for left ear stimulation. Both groups showed a strong ipsilateral (i.e. left hemisphere) dominance. 0 5 10 15 20 25 30 35 Time (seconds)