Download

1 / 36
360 likes | 580 Vues
Grid Integration of Electric Vehicles and Demand Response with Customer Choices. S. Shao, M. Pipattanasomporn , and S. Rahman , “Grid Integration of Electric Vehicles and Demand Response with Customer Choices,” IEEE Transactions on Smart Grid, vol. 3, no. 1, Mar. 2012.

E N D
Grid Integration of Electric Vehicles and Demand Response with Customer Choices S. Shao, M. Pipattanasomporn, and S. Rahman, “Grid Integration of Electric Vehicles and Demand Response with Customer Choices,” IEEE Transactions on Smart Grid, vol. 3, no. 1, Mar. 2012. S. Shao, M. Pipattanasomporn, and S. Rahman, “Demand Response as a Load Shaping Tool in an Intelligent Grid with Electric Vehicles,” IEEE Transactions on Smart Grid, vol. 2, no. 4, Dec. 2011. BBCR Smart Grid Research Group Meeting Chia-Ho Ou
Contributions • Propose a demand response (DR)strategy to accommodate electric vehicle (EV)charging on a residential distribution circuit • Goal • Keep the peak demand (before EV penetration) unchanged • Consumer comfort indicesare introduced Chia-Ho Ou
Outline • Motivations • Modeling of circuit load and EV charge profiles • Demand response strategy design • Consumer comfort indices • Case study • Concluding remarks Chia-Ho Ou
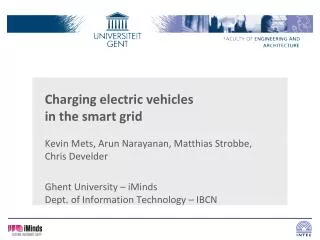
Motivations • The impact of EVs on electric power systems cannot be overlooked. • EV penetration may bring higher peak demand • Majority of previous work regarding the impact of EV penetration on electric power systems focuses at the transmission level • Recent research started to turn to the distribution level Chia-Ho Ou
Introduction Transmission level Distribution level This picture is obtained from Wikipedia Chia-Ho Ou
Motivations (cont.) • Analysis of EV penetration into the distribution network is quite extensive • There is still a need to • Take into consideration the vehicle driving patterns • Develop a demand response strategy that will accommodate EV fleets Chia-Ho Ou
Motivations (cont.) • Demand response applications in industrial and commercial sectors have been well studied • Residential demand response strategy taking into account the consumer comfort still needs an in-depth study • There is the lack of indices to measure the impacts of demand response on consumer convenience Chia-Ho Ou
Modeling of Distribution Circuit Load • Hourly load curves of an average household are based on the RELOAD [1] database • Residential loads are classified by nine types: • Space cooling, space heating, water heating, cloth drying, cooking, refrigeration, freezer, lighting, others [1] RELOAD Database Documentation and Evaluation and Use in NEMS [Online]. Available: http://www.onlocationinc.com/LoadShapes-Reload2001.pdf Chia-Ho Ou
Modeling of Distribution Circuit Load (cont.) • In the papers, the residential loads are classified into two categories: • Controllable: the loads that can be controlled without noticeable impacts on consumer’s life style • Space cooling/heating, water heating, cloth drying • Critical: the loads that are either very important or cannot be controlled • Others Chia-Ho Ou
Modeling of EV Fleet Charge • A survey [2] indicates that the EV plug-in time (coming home time) is close to a normal distribution curve • The papers use a normal probability distribution function to describe the EV fleet plug-in time [2] J. Taylor, A. Maitra, M. Alexander, D. Brooks, and M. Duvall, “Evaluation of the impact of plug-in electric vehicle loading on distribution system operations,” in Proc. IEEE PES Gen. Meet., Jul. 26–30, 2009. Chia-Ho Ou
Modeling of EV Fleet Charge (cont.) (EV plug in time) Mean at 6pm and the variance of 1 h Chia-Ho Ou
Modeling of EV Fleet Charge (cont.) • A study [3] uses the Monte Carlo method to simulate the daily driving distance for each EV in the distribution circuit [3] National Household Travel Survey Oakridge National Laboratory, 2001 [Online]. Available: http://nhts.ornl.gov/index.shtml Chia-Ho Ou
Modeling of EV Fleet Charge (cont.) • Battery usable capacities and charging power requirements (kW) * Recommended charging rate Chia-Ho Ou
Demand Response Strategy Design • The proposed DR strategy is designed in two layers • Neighborhood Area Network (NAN) • Home Area Network (HAN) Chia-Ho Ou
Demand Limit Allocation for Each House at NAN • Original peak load (before EV penetration) should be set as the demand limit for whole circuit • NAN control center sorts all reported demand within a distribution circuit • Household demand limit (DLi) is set at the point where the summation of all household to be served is equal to or less than the original peak load Chia-Ho Ou
Demand Limit Allocation for Each House at NAN (cont.) (Original peak load) Chia-Ho Ou
Optimization Problem Chia-Ho Ou
Demand Response Strategy in HAN Step1) Customers set the load priority for each appliance Step2) Customers perform preference settings for each appliance (highest) Chia-Ho Ou
Demand Response Strategy in HAN (cont.) • Step3) HAN control center will compare the total household power consumption (ph,i) with the demand limit (DLi) • If ph,i > DLi, demand response will be performed Chia-Ho Ou
Consumer Comfort Indices • Evaluate DR impacts on consumer comfort levels • Indices are defined based on severity, scale, and duration of convenience violations for each controllable appliance Chia-Ho Ou
Severity Indices • Measure how severely the consumer comfort levels are violated • Based on the maximum percentage deviation from the original settings Chia-Ho Ou
Severity Indices (cont.) • Severity indices for HVACs • The largest temperaturedeviation in percentage taking into account all homes in a distribution circuit Chia-Ho Ou
Severity Indices (cont.) • Severity indices for water heater (temperature) • Severity indices for clothes dryer (time delay) • Severity indices for electric vehicles (time delay) Chia-Ho Ou
Scale Indices • Measure the number of consumers whose comfort levels are violated as a percentage of a total household • Scale indices for HVACs • nHVAC: the number of homes with the temperature out of preset comfort ranges in each time slot • N: the total number of consumers • ORAC: ownership rate of HVACs Chia-Ho Ou
Scale Indices (cont.) • Scale indices for water heaters • Scale indices for clothes dryers • Scale indices for electric vehicles Chia-Ho Ou
Duration Indices • Describe the length of the inconvenient period for HVAC and water heater • Duration indices for HVACs • Duration indices for water heaters Chia-Ho Ou
Case Study • Circuit 9 in the Virginia Tech Electric Service (VTES) area is taken as a case study • 780 homes • 780*1.9 = 1482 vehicles • EV penetration levels: • 50 (3.3%) EVs and 100 (6.6%) EVs • EV charging model • Mix of 40% Chevy Volt, 40% Nissan LEAF, and 20% Tesla Roadster Chia-Ho Ou
Results Chia-Ho Ou
Summer load profiles 50 EVs 100 EVs Chia-Ho Ou
50 EVs Winter load profiles 100 EVs Chia-Ho Ou
Consumer Comfort Indices (Summer) Chia-Ho Ou
Consumer Comfort Indices (Winter) Chia-Ho Ou
Concluding Remarks • EV fleet charge profiles are modeled based on driving distances and battery sizes • DR strategy provides the utility with unchanged peak demand to avoid distribution circuit upgrade • Maintain the same peak load with higher EV penetration levels may impact the consumer’s convenience • Utilities can use the consumer comfort indices to estimate the capability of demand response programs Chia-Ho Ou
Thank you! Chia-Ho Ou