
SlideServe
Menu
Préférences
© SlideServe · v2026

Nitrogen Metabolism Model

hada avatar
12 diapositives · 834 Views · Aug 21, 2012

Nitrogen Metabolism Model. Nicholas Rohacz, Student Seaver 120, Feb. 24 2011. Outline. Discuss purpose of Nitrogen Metabolism Model Present state variables and explain State differential equations and discuss Explanation of terms used in differential equations Discuss parameters
Nitrogen Metabolism Model - slide 1
01 / 12Nitrogen Metabolism Model
1 / 17

Télécharger la présentation

Nitrogen Metabolism Model
Une image / un lien ci-dessous est fourni (tel quel) pour télécharger la présentation

Politique de téléchargement : le contenu du site vous est fourni TEL QUEL pour votre information et votre usage personnel ; il ne peut être vendu, concédé sous licence ni partagé sur d’autres sites sans l’accord de son auteur.Le contenu vous est fourni TEL QUEL, pour votre information et votre usage personnel uniquement. Téléchargez la présentation en cliquant sur ce lien. Lors du téléchargement, si vous ne parvenez pas à télécharger une présentation, l’éditeur a peut-être supprimé le fichier de son serveur.Pendant le téléchargement, si vous ne parvenez pas à obtenir une présentation, le fichier a peut-être été supprimé par l’éditeur.

F I N

Plus de contenu associé

Transcription de la présentation
  1. Nitrogen Metabolism Model Nicholas Rohacz, Student Seaver 120, Feb. 24 2011

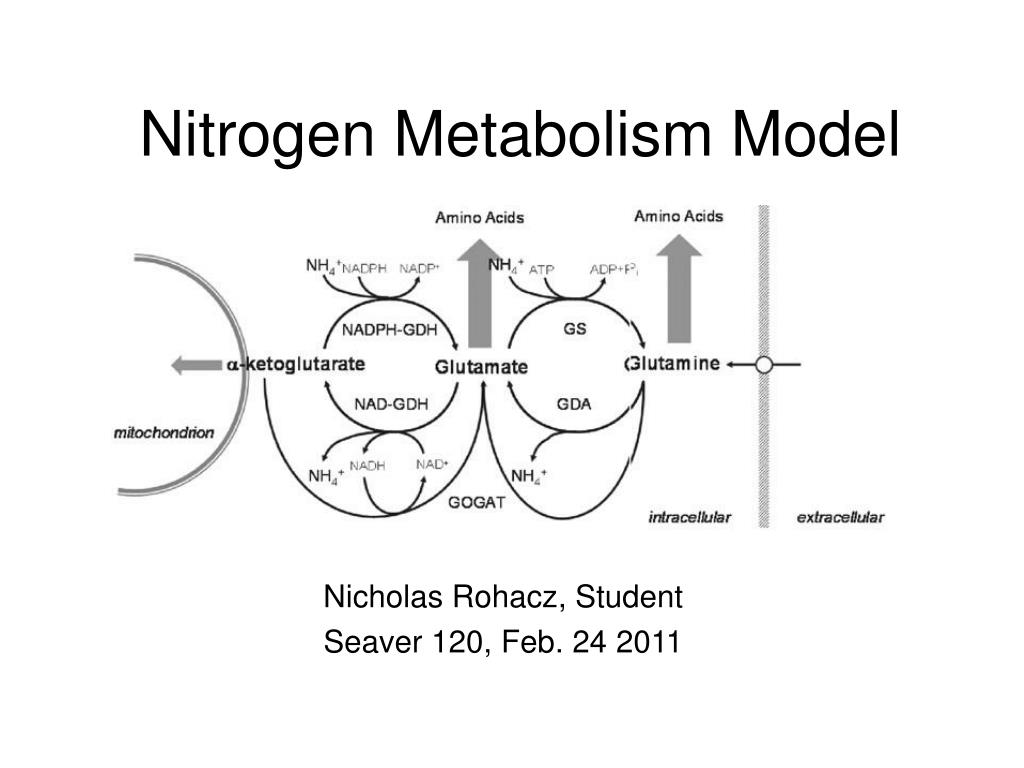
  2. Outline • Discuss purpose of Nitrogen Metabolism Model • Present state variables and explain • State differential equations and discuss • Explanation of terms used in differential equations • Discuss parameters • Graph resulting from simulation of Nitrogen Model • Trends resulting in changing of parameters • Trends (cont’d) • Discussion of modeling process

  3. Purpose • The purpose of this model is to determine how the concentrations of glutamate, glutamine, and -ketoglutarate change over time. • Also how these concentrations change along with changes in the concentrations of the state variables. • The significance of this model is to show how nitrogen metabolism is affected

  4. State Variables • k , shown in the equations as k1, k2, k3, k4, and k5, represent the five reaction rates for the five separate pathways. • Vmax, shown in the equations as V1, V2, V3, V4, and V5, represents the volume of the mixture, =k(n)*e0 • D represents the dilution rate, which is the flux of ammonium into the cell. • u is the feed rate, or the rate at which ammonium is pumped into the system.

  5. Parameters • [mate] is the starting concentration of glutamate in the system. • [mine] is the starting concentration of glutamine in the system. • [-keto] is the starting concentration of -ketoglutarate in the system. • [NH4] is the starting concentration of ammonium in the system.

  6. Differential Equations • d[mate]/dt = -V3*[mate]/(k3+[mate]) + V4*(([-keto]*[NH4])/(k4+[-keto]*[NH4])) - V2*(([mate]*[NH4])/(k2+[mate]*[NH4])) + V1*[mine]/(k1+[mine]) + V5*(([-keto]*[mine])/(k5+[-keto]*[mine])) • d[mine]/dt = -V1*[mine]/(k1+[mine]) + V2*(([mate]*[NH4])/(k2+[mate]*[NH4])) • d[-keto]/dt = -V4*(([-keto]*[NH4])/(k4+[-keto]*[NH4]) + V3*[mate]/(k3+[mate])) • d[NH4+]/dt = D*u + V1*[mine]/(k1+[mine]) + V3*[mate]/(k3+[mate]) - V2*(([mate]*[NH4])/(k2+[mate]*[NH4])) - V4*(([-keto]*[NH4])/(k4+[-keto]*[NH4]))

  7. Explanation of Terms • D*u is the inflow, only used in ammonium rate. • V1*[mine]/(k1+[mine]) represents the pathway from glutamine to glutamate, produces ammonium ion. • V2*(([mate]*[NH4+])/(k2+[mate]*[NH4+])) represents the pathway from glutamate to glutamine, consumes ammonium. • V3*[mate]/(k3+[mate]) represents pathway from glutamate to -ketoglutarate, produces ammonium ion, this is a two substrate reaction. • V4*(([-keto]*[NH4+])/(k4+[-keto]*[NH4+])) represents pathway from -ketoglutarate to glutamate, consumes ammonium ion, this is a two substrate reaction. • V5*(([-keto]*[mine])/(k5+[-keto]*[mine])) represents the process where -ketoglutarate and glutamine exchange an ammonium ion • +/- represent the the production/consumption of product

  8. Graph

  9. Trends D=.05 => D=.29 V=1 => V=5 k=2 => k=.5

  10. Trends (cont’d) u=5 => u=20 k=2 => k=.5

  11. Discussion • The concentrations of glutamine and -ketoglutarate stayed relatively constant over time, even with changes in the state variables. • Glutamate increased linearly due to three pathways producing glutamate, two consuming it, essentially, 3x-2x=x. • Ammonium has a period of loss, due to the formation of the glutamate and glutamine substrate, and then one of growth, due to the backwards pathway. • Some future directions to explore would be if there was enough stress on the system would it differ in how much substrate was produced.

  12. References • Not sure how to reference my own class, however, I would like to thank Dr. Dahlquist and Dr. Fitzpatrick for picture, from class on 2/17/11. URL: https://mylmuconnect.lmu.edu/webapps/portal/frameset.jsp?tab_tab_group_id=_2_1&url=%2Fwebapps%2Fblackboard%2Fexecute%2Flauncher%3Ftype%3DCourse%26id%3D_21252_1%26url%3D