Download
1 / 15
150 likes | 275 Vues
WEC Committee on the Performance of Generating Plant Benchmark Globally – Improve Plant Performance Locally Presented by Scott Stallard Black & Veatch WG1 Chairman. Significant Opportunity to Reduce Emissions Through Performance Improvement.

E N D
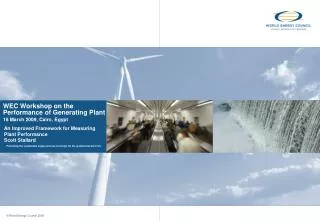
WEC Committee on the Performance of Generating Plant Benchmark Globally – Improve Plant Performance Locally Presented by Scott Stallard Black & Veatch WG1 Chairman
Significant Opportunity to Reduce Emissions Through Performance Improvement • The World Energy Council (WEC) and others have shown in past that there is significant opportunity to reduce baseline emissions and fuel consumption by: • Improvements to plant and transmission/distribution efficiencies. • Improvements to management practices • Reliability • Fuel Utilization • Efficiency • Capacity • Improvements can pay for themselves
Matching Analytics to Market Realities • Since the 1990’s, increasing competition and deregulation of the electricity sector has had significant implications for plant operations and associated metrics – and for the value of historical data collection/analysis techniques. • Focus on how to better leverage data and analysis to improve individual unit performance. • Benchmarking for comparison of unit performance against that of its peers became critical.
Matching Analytics to Market Realities • Three important distinctions arose: • Collecting adequate and complete unit-specific data is increasingly challenging given the competitive nature of the industry. • Data distributions can provide significant insight to measure performance gaps and “opportunity” for improvement. • More work is required to translate technical performance “gaps” into financial terms as well as consider other cost-based performance issues such as efficiency.
PGP World Wide Performance Database • PGP database collects unit-by-unit performance hours/MWh lost vs. performance indices. This allows the PGP database to calculate various performance indices, including: • Energy Availability Factor (EAF) • Unit Capability Factor (UCF • Unplanned Capability Loss Factor (UCLF) • Planned Capability Loss Factor (PCLF) • Load Factor (LF) • Unplanned Automatic Grid Separations per 7000 hours of operation (UAGS 7) • Utilization Factor (UF) • Unplanned Energy Loss Rate (UELR) • PGP focus is to support performance improvement across the whole of the worldwide Electric Supply Industry
Benchmarking • Benchmarking has been widely applied for comparing plant performance against other plants in order to: • Set realistic goals • Identify opportunities for improvement, • Give advance warning of threats • Set appropriate incentives • Trade knowledge and experiences with their peers • Quantify and manage performance risks
Benchmarking • Benchmarking can open organizations to new methods, ideas and tools to improve bottom-line results by demonstrating how different processes and approaches can realistically yield improved results. • Simultaneously considers the impact design and operational variables have on the performance of the unit or group of similar units.
Defining a Top Performer … • Industry “best practices” often associate performance with ranking. Hence, it is often useful to measure performance within the context of industry ranking, or often more simply, within the context of “deciles” or “quartiles.” • On What Basis? • Availability? • Forced Outage Rate? • Generation Costs? • Emissions? • Value?
Looking at Performance as Distribution • The average performance for EAF and EFOR for this analysis are 85.8% and 8.2%, respectively. • Based on these values, the “improvement” required to elevate performance from average to top quartile or top decile would be as follows.
Different Circumstances Yield Different Value Propositions for Performance Improvement • In our example, to move from average EFOR performer to top-quartile and top-decile would require improvements of 7.7 and 10.4%, respectively. • Is the right goal? What level of capital investment and/or changes in O&M are likelyrequired to reach such targets? • PGP is developing a “model” to help help place technical performance within the context of financial performance.
A Shift in Focus is Needed • Our WEC work suggests … • Need to look beyond “current” points of emphasis – safety, skills development, sound O&M practices, reliability and more recently, commercial availability • More emphasis needed on efficiency/capacity issues/associated emissions and ways to address “financial” implications of markets • Unique opportunity to employ innovative practices and proactive, diagnostic tools/processes to simultaneously address reliability, power production costs, and emissions • Performance Monitoring/Predictive maintenance tools • Large-Scale Plant Optimization • Plant advisory systems for rapid identification/corrective action • Monitoring and Diagnostic centers • Advanced Benchmarking processes/tools – to address both technical and financial aspects of the issue.